


Support and resistance are the first concepts every trader learns and, for many, the last ones they ever truly master. Almost any strategy — whether it leans on indicators, price action, or a mix of both — ultimately comes back to a simple question: where is price likely to stall, reverse, or break through? Support and resistance levels are the market’s way of answering that question, and learning to read them well is one of the highest-leverage skills a trader can build.
This guide covers what support and resistance actually represent, how to identify levels that matter versus ones that are just noise, what happens when a level breaks, and how to combine support and resistance with the other tools in your toolkit for higher-confidence setups.
- What Are Support and Resistance Levels?
- Why Price Reacts at These Levels
- How to Draw Support and Resistance Correctly
- Strong vs Weak Levels
- The Support/Resistance Flip
- Combining Support and Resistance With Other Tools
- Common Mistakes to Avoid
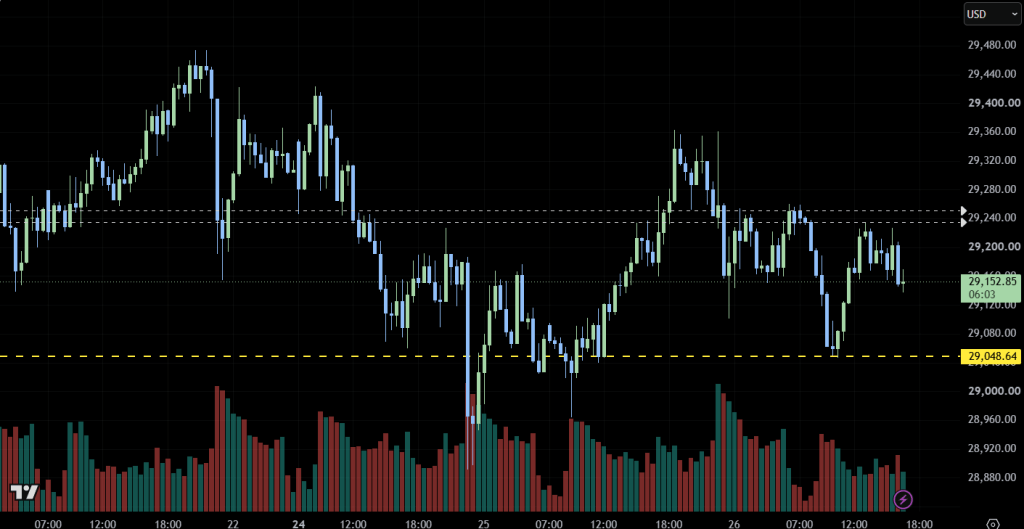
The chart above shows NAS100 on the 30-minute timeframe with two clean examples: a resistance zone around 29,240.00 that has capped multiple rally attempts, and a support zone around 29,048.64 that has held on repeated tests. Notice that price doesn’t need to touch the exact same price to the decimal each time — it reacts within a zone, not a single line.
What Are Support and Resistance Levels?
Support is a price area where buying pressure has historically been strong enough to stop or reverse a decline. Resistance is the opposite — a price area where selling pressure has historically been strong enough to stop or reverse an advance. In an uptrend, former resistance levels often become new support once broken; in a downtrend, former support levels often become new resistance.
These levels exist because markets have memory. Traders who bought near a low remember that price and are inclined to defend it; traders who missed a rally and watched it reverse near a high remember that price too, and treat a retest as a second chance to sell. That collective memory is what turns a random price into a meaningful one.
Why Price Reacts at These Levels
Three groups of market participants tend to cluster their orders around well-known support and resistance zones, which is exactly what reinforces them:
- Existing position holders place stop-loss and take-profit orders just beyond these levels, creating pockets of concentrated order flow.
- Breakout traders wait for a level to break before entering, adding momentum once it does.
- Mean-reversion traders fade the level, betting it holds one more time, which is what creates the bounce in the first place.
None of this requires any conspiracy or manipulation — it’s simply what happens when large numbers of participants are all looking at the same obvious price on the same chart.
How to Draw Support and Resistance Correctly
A common beginner mistake is drawing a level through the exact tip of a single wick and expecting price to respect that precise number forever. In practice, support and resistance are better treated as zones rather than hairlines:
- Look for areas where price has reversed more than once, not just a single touch.
- Favor levels that align with round numbers, prior swing highs/lows, or session opens — these attract extra attention from other traders.
- Draw the line through the body/wick cluster rather than a single outlier spike, and think of it as a zone a few points wide rather than one exact price.
- Check the level across multiple timeframes — a level that shows up on both the 1-hour and daily chart carries more weight than one that only appears on a 5-minute chart.
Strong vs Weak Levels
Not every support or resistance level deserves the same respect. A few factors tend to separate levels worth trading around from ones that are just visual noise:
- Number of touches: a level tested three or four times without breaking is generally more significant than one tested once — though a level tested too many times can also be wearing down and closer to breaking.
- Timeframe: daily and weekly levels tend to matter more than intraday ones, since more participants are watching them.
- Volume behavior: a bounce on rising volume suggests genuine buying or selling interest at the level; a weak bounce on thin volume is less convincing.
- Reaction speed: a sharp, fast rejection from a level often indicates stronger conviction than a slow grind through it.
The Support/Resistance Flip
One of the most useful concepts in this entire topic is the role reversal: once a resistance level is broken with conviction, it frequently becomes support on the retest — and vice versa when support breaks down. This happens because the participants who were trapped on the wrong side of the break (sellers who shorted resistance, or buyers who bought support) now have an incentive to defend their new breakeven level once price returns to it.
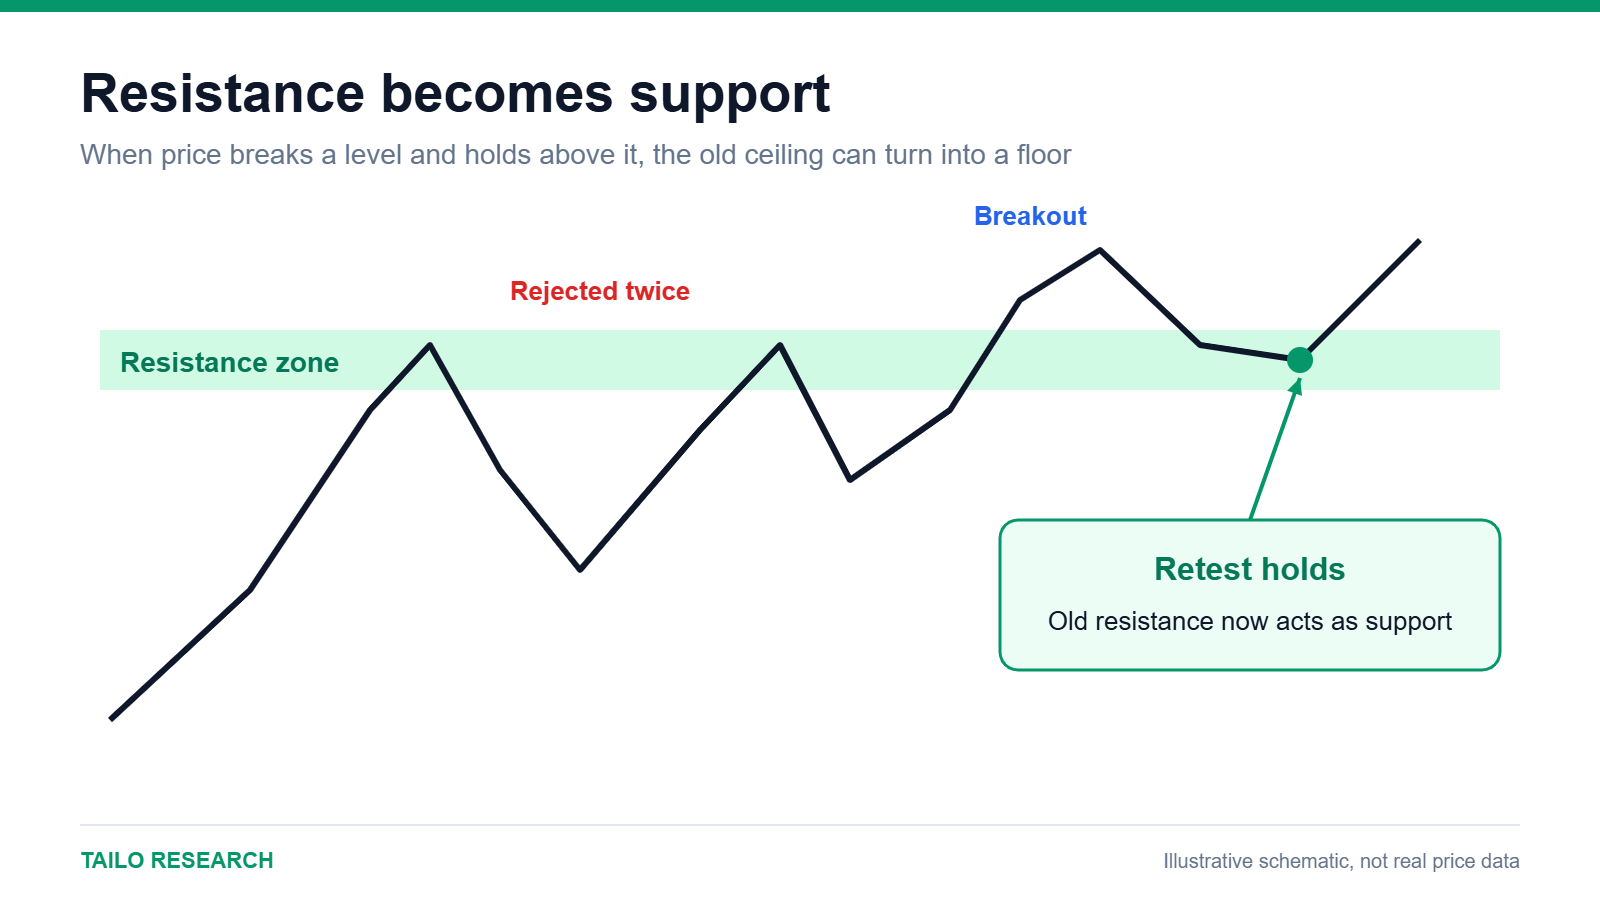
This flip is the basis for one of the more reliable entry techniques in trading: rather than chasing a breakout the moment it happens, many traders wait for the retest of the broken level, using the flip as both an entry trigger and a natural place to set a stop-loss just beyond it.
Combining Support and Resistance With Other Tools
Support and resistance work best as a framework that other tools layer onto, rather than as a standalone system. A few combinations worth knowing:
- Using RSI to check whether momentum is overbought or oversold as price approaches a key level, rather than trading the level in isolation.
- Watching for MACD crossovers near support or resistance to help confirm whether momentum actually supports a bounce or a breakout.
- Using moving averages that happen to align with a horizontal level, since confluence between the two adds extra weight to the zone.
- Checking whether a level sits inside or outside the Ichimoku cloud, which can add trend context to a horizontal support/resistance read.
- Watching whether Bollinger Bands are compressing near a key level, which can hint that a breakout is building.
Common Mistakes to Avoid
A few habits tend to separate traders who use support and resistance well from those who get repeatedly whipsawed by it:
- Treating levels as exact prices instead of zones, then feeling “wrong” when price reverses a few points before or after the drawn line.
- Chasing every breakout without waiting for confirmation or a retest, which is a common way to get caught in false breaks.
- Drawing too many levels on one chart, which makes almost every price look significant and defeats the purpose of the exercise.
- Ignoring higher timeframes and trading only levels visible on a lower timeframe chart, missing the bigger structural picture.
Support and resistance won’t tell you exactly when a reversal or breakout will happen, but they give you a map of where the market is most likely to make a decision — which is often enough to build a genuine edge around, especially once combined with momentum and trend tools to confirm the read.
For related reading, see our guides to RSI, MACD, Moving Averages, the Ichimoku Cloud, and Bollinger Bands.
If you want to put these support and resistance concepts into practice, Vantage Markets gives you access to NAS100 and other major markets with competitive spreads and fast execution. Open a free Vantage Markets account and start applying what you’ve learned.
This content is for informational and educational purposes only and does not constitute financial advice. Trading CFDs carries a high level of risk and may not be suitable for all investors. Past performance is not indicative of future results. Please read our full Risk Disclaimer and Affiliate Disclosure before making any trading decisions.


Leave a Reply