

MACD — short for Moving Average Convergence Divergence — is one of the most widely used momentum indicators in trading, built into virtually every charting platform and taught in nearly every technical analysis course. Developed by Gerald Appel in the late 1970s, it remains popular today because it does two things at once: it tracks trend direction and momentum strength in a single, easy-to-read indicator. This guide breaks down how MACD is built, the three signals it generates, and how to read it on a real chart without falling into the common traps that catch beginner traders.
What Is MACD?
MACD is built from two exponential moving averages (EMAs) — a fast one and a slow one — and measures the distance between them. When the fast EMA is above the slow EMA and pulling away, momentum is building to the upside. When the fast EMA falls below the slow EMA, momentum is shifting down. Unlike a simple moving average crossover on the price chart, MACD plots this relationship as its own oscillator below the price chart, making shifts in momentum easier to spot at a glance.
The Three Parts of MACD
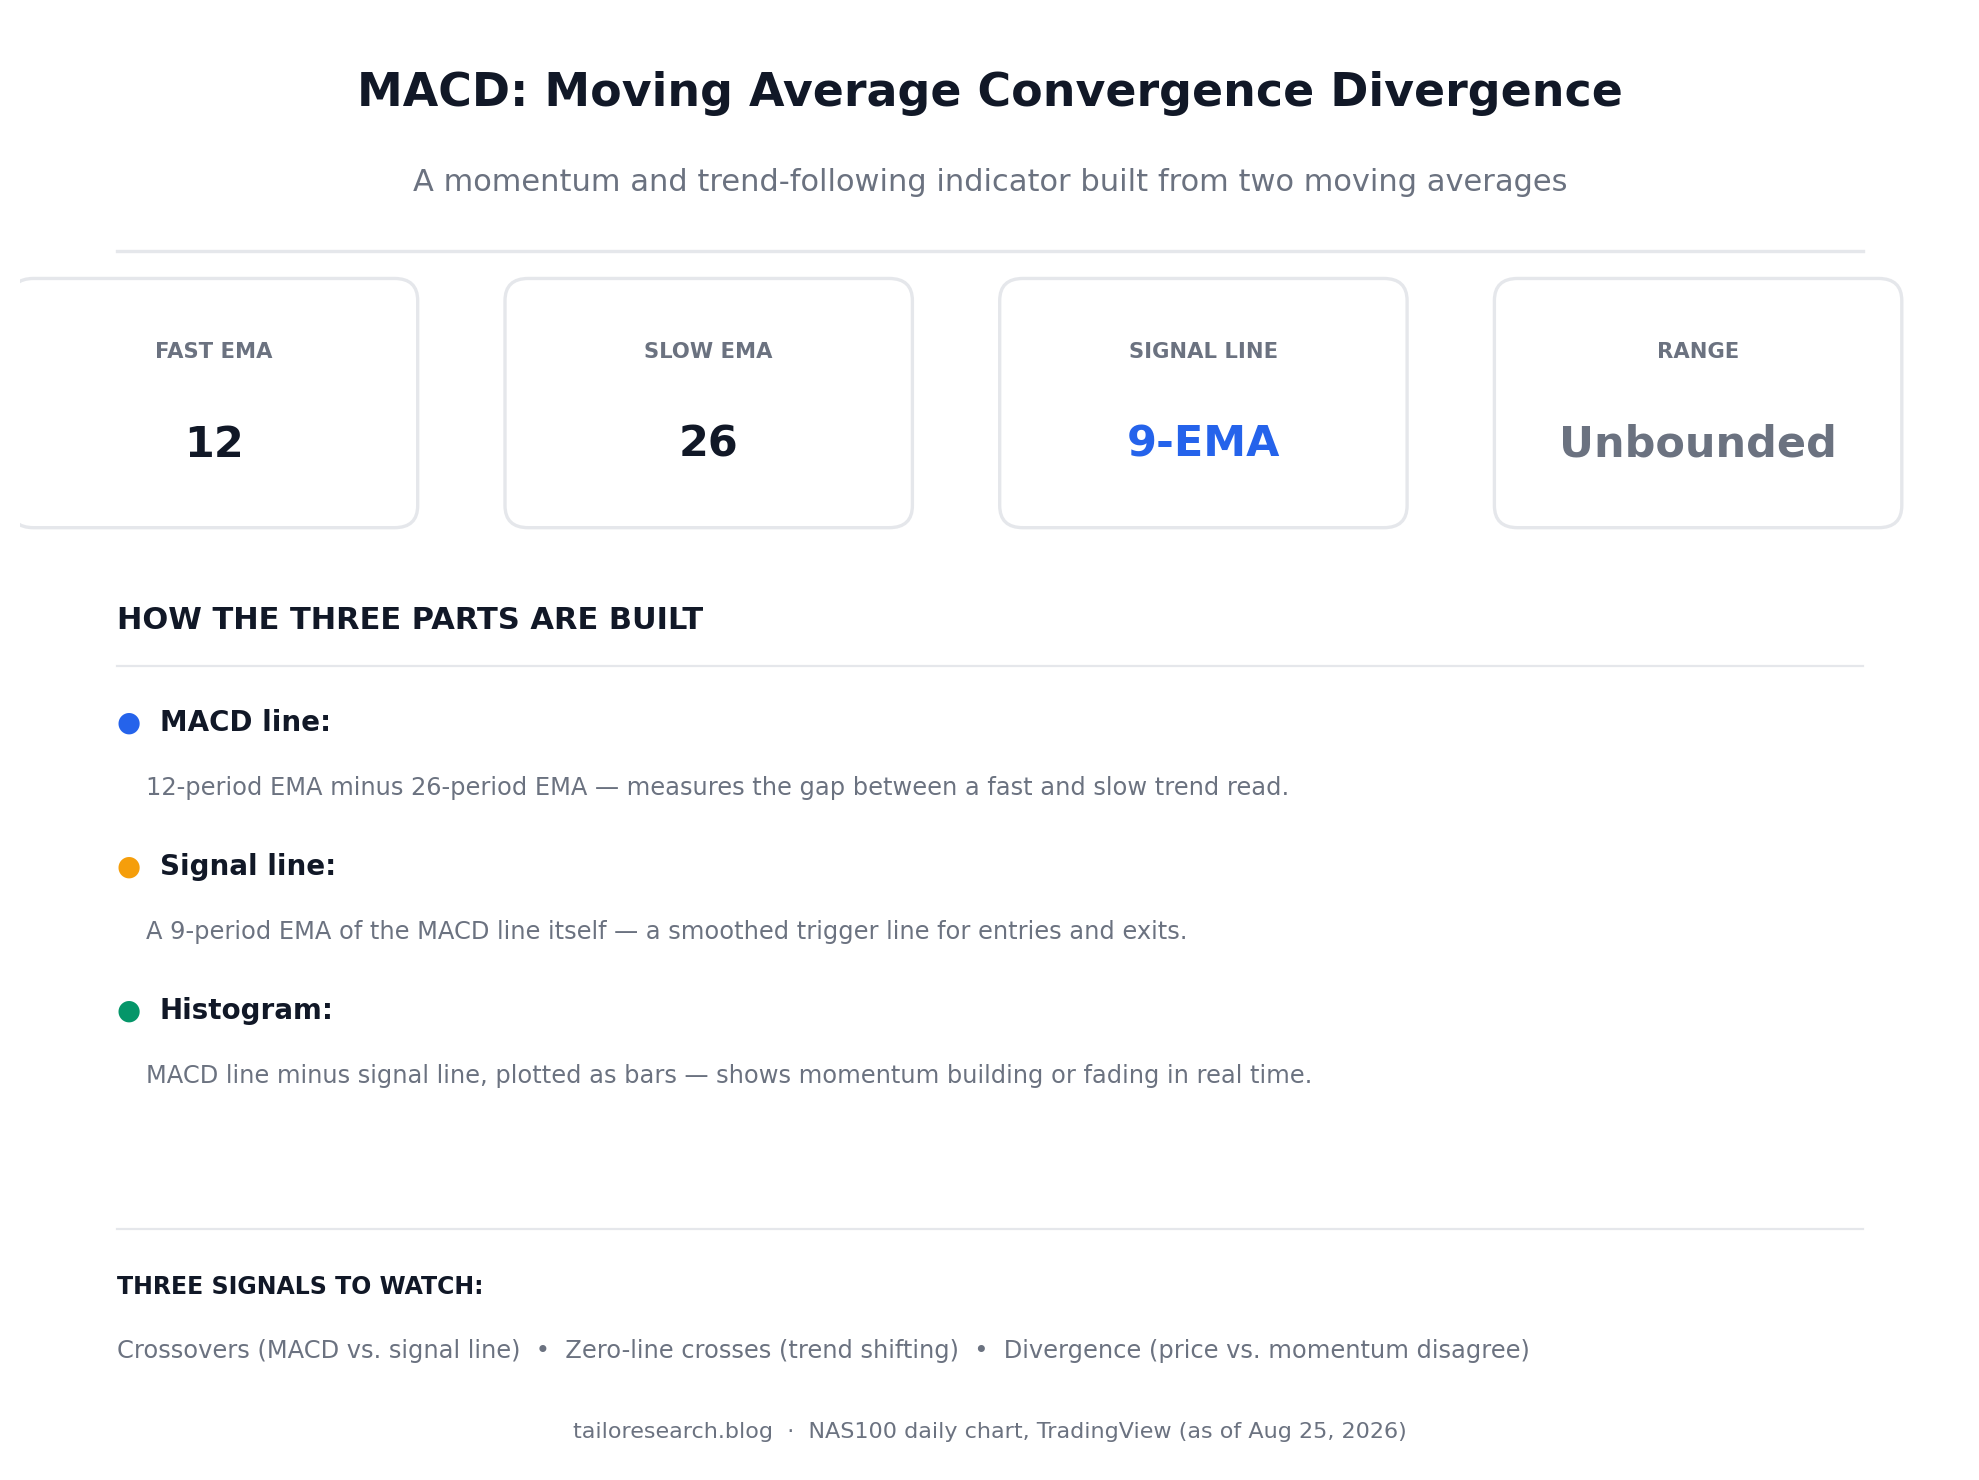
Every MACD reading is made up of three separate elements layered on top of each other, and understanding what each one measures is the key to reading the indicator correctly.
- The MACD line: calculated as the 12-period EMA minus the 26-period EMA. This is the core of the indicator — it rises when the fast average is pulling away from the slow average (accelerating momentum) and falls when the gap narrows or reverses.
- The signal line: a 9-period EMA of the MACD line itself. Because it’s a smoothed version of the MACD line, it lags slightly behind — which is exactly what makes it useful as a trigger line for crossovers.
- The histogram: the difference between the MACD line and the signal line, plotted as bars. When the bars are growing, momentum is accelerating in that direction; when they start shrinking, momentum is fading even if price is still moving the same way.
MACD on a Real Chart
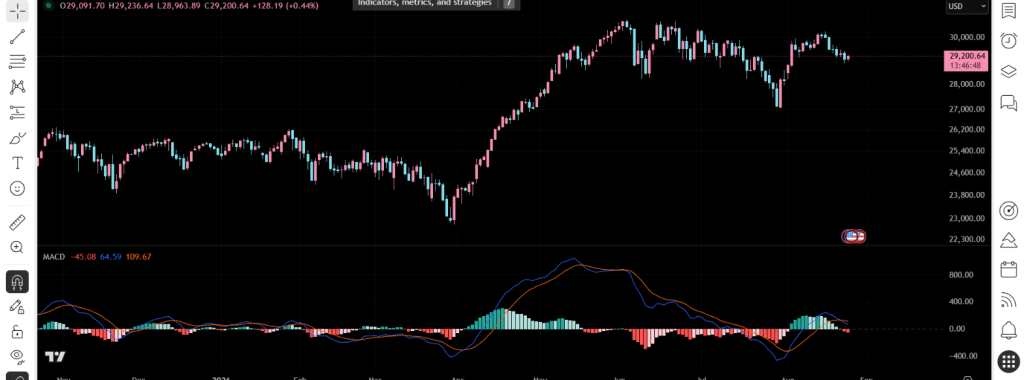
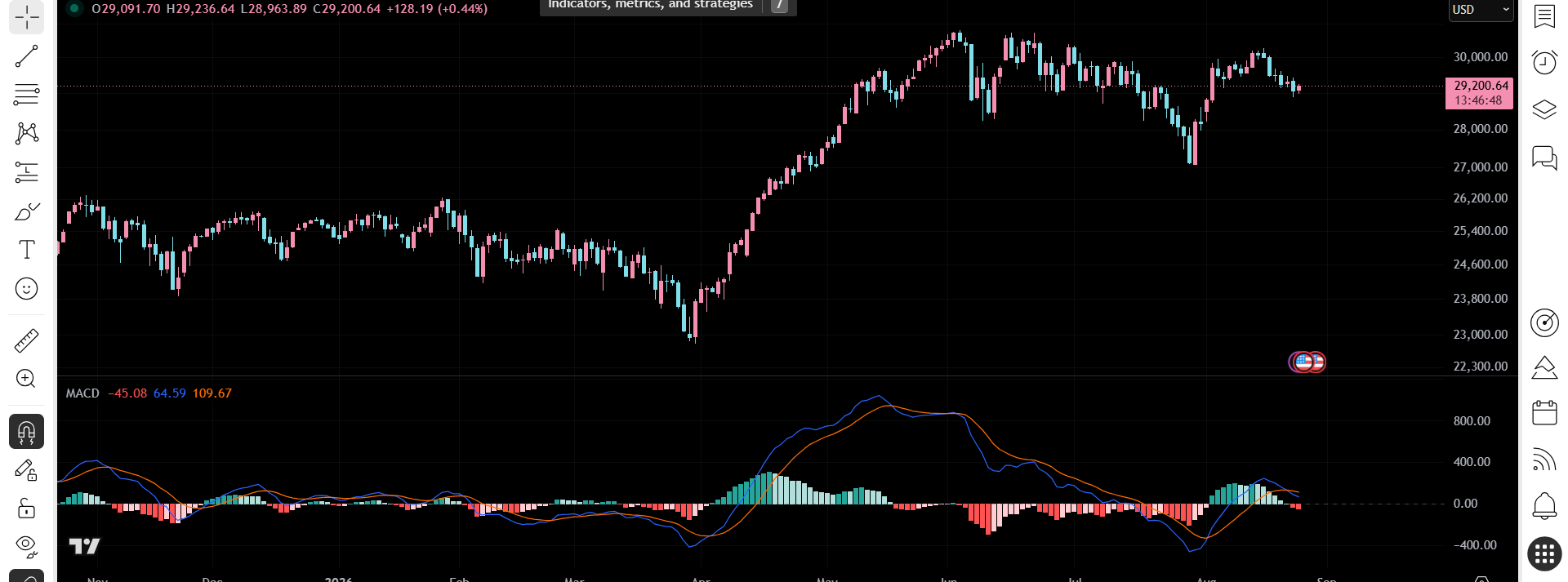
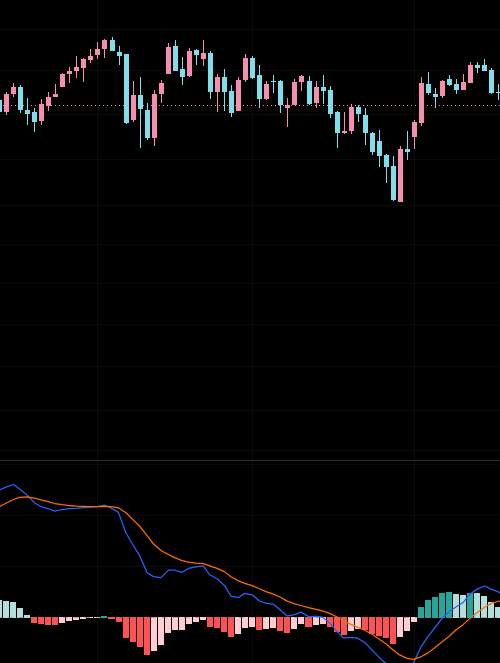
Here’s MACD applied to the Nasdaq 100 (NAS100) daily chart. Notice how the histogram expands and contracts as the blue MACD line and orange signal line converge and diverge — this is the “convergence divergence” the indicator is named for.
Signal #1: Crossovers
The most common way traders use MACD is watching for the MACD line to cross the signal line. A bullish crossover happens when the MACD line crosses above the signal line — the histogram flips from red to positive, signaling that upward momentum is taking over. A bearish crossover is the mirror image: the MACD line crosses below the signal line, and the histogram turns negative, signaling downward momentum is gaining control. Crossovers that happen further below the zero line (after a deep pullback) tend to carry more weight than crossovers that happen close to zero, which are more prone to whipsaws in choppy, sideways markets.
Signal #2: Zero-Line Crosses
The zero line represents the point where the fast and slow EMAs are exactly equal. When the MACD line crosses above zero, the fast EMA has moved above the slow EMA — a broader signal that the underlying trend itself may be turning bullish, not just a short-term momentum blip. A cross below zero signals the opposite. Zero-line crosses tend to lag price turns more than signal-line crossovers do, but they’re less prone to false signals, which is why many traders use them to confirm the trend direction before acting on a faster crossover signal.
Signal #3: Divergence
Divergence is widely considered the most powerful — and most misused — MACD signal. Bearish divergence occurs when price makes a higher high, but MACD makes a lower high — a warning that the rally is losing underlying momentum even as price grinds higher. Bullish divergence is the reverse: price makes a lower low, but MACD makes a higher low, hinting that selling pressure is fading before price confirms it. Divergence is a warning sign, not a trade signal by itself — it can persist for a long time before price actually reverses, so most traders wait for a crossover or a clear price-action confirmation before acting on it.
Price Action and MACD Together
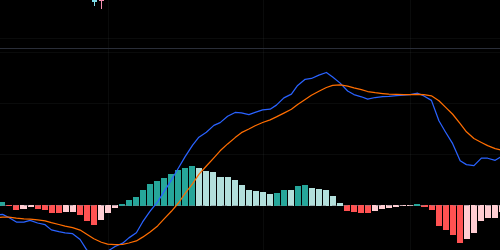
MACD reads most reliably when it’s viewed alongside the price chart it’s derived from, rather than in isolation. The section below shows a full cycle: a bearish crossover as price rolls over into a decline, MACD staying below zero through the sell-off, and a fresh bullish crossover forming as price begins to recover — exactly the kind of sequence that makes MACD useful for confirming a trend change rather than guessing at one.
Common Mistakes to Avoid
- Trading every crossover blindly. In a sideways, range-bound market, MACD generates frequent false crossovers as the two EMAs repeatedly cross near the zero line. Check whether the broader trend supports the signal before acting on it.
- Ignoring that MACD is a lagging indicator. Because it’s built from moving averages, MACD confirms momentum shifts after they’ve already started — it won’t catch the exact top or bottom.
- Using MACD alone. Most experienced traders pair MACD with support/resistance levels, volume, or another indicator like RSI rather than trading its signals in isolation.
- Chasing divergence too early. Divergence can build for weeks before price actually turns — treat it as an early warning, not an entry trigger on its own.
Putting MACD to Work
MACD works well as a momentum filter layered on top of a broader trading plan: use the zero-line position to gauge the dominant trend, watch crossovers for entry and exit timing within that trend, and treat divergence as a signal to tighten risk management rather than an automatic reversal call. Like every indicator, it describes what price has already done — it’s a tool for organizing your read of momentum, not a substitute for a full trading plan with defined risk on every position.
For related reading, see our guides to RSI, Moving Averages (SMA and EMA), and Bollinger Bands, Support and Resistance, Fibonacci Retracement, Candlestick Patterns, Chart Patterns, and Risk Management.
Want to practice reading MACD signals on a live chart with tight spreads and fast execution? Vantage Markets gives you access to NAS100 and other major markets to put these concepts to work. Open a free Vantage Markets account and start applying what you’ve learned.
Risk Disclaimer: Trading CFDs and leveraged products carries a high level of risk and may not be suitable for all investors. Past performance is not indicative of future results. This article is for educational purposes only and does not constitute financial advice. Affiliate Disclosure: This post contains an affiliate link. If you open an account through it, tailoresearch.blog may earn a commission at no extra cost to you.


Leave a Reply