

Every candle on a chart tells a small story about the fight between buyers and sellers over that period, and certain shapes tend to repeat often enough that traders have given them names: doji, hammer, engulfing, and a handful of others. None of these patterns work as a standalone signal, but read in context — at the right location on the chart, after the right kind of move — they can offer an early clue that momentum is shifting.
This guide covers what a candle’s shape actually tells you, the handful of patterns worth knowing well, a real example from NAS100 price action, and how to avoid the most common mistake beginners make with candlestick analysis: trading the shape without the context.
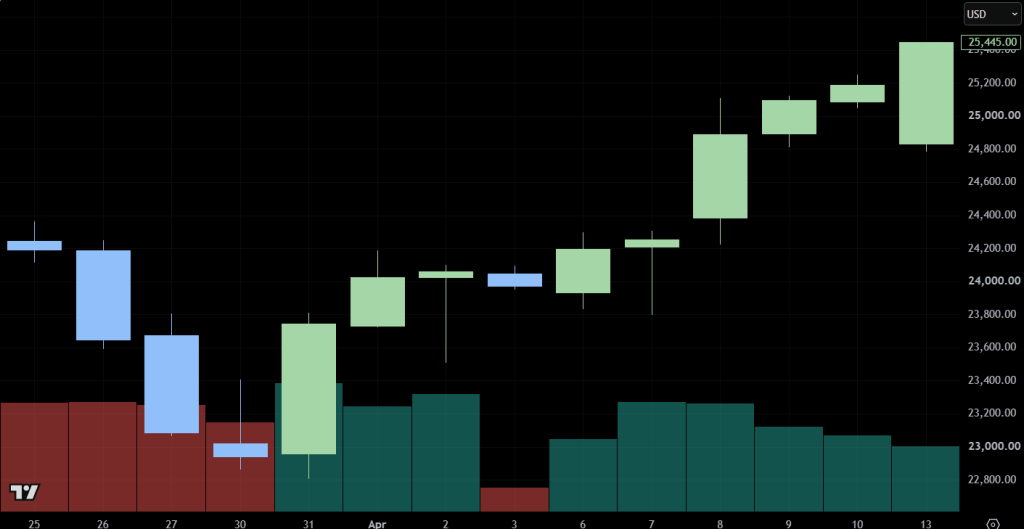
The chart above shows a clean real-world example on NAS100’s daily chart. After two down days into March 30, the candle on March 31 opens near the prior low, pushes down further intraday (the long lower wick), then rallies to close strongly higher — a classic hammer-style reversal candle that also engulfs the small body from the day before. Two small-bodied, indecisive candles follow on April 2 and 3, and price then breaks into a sustained bullish run through mid-April.
What a Candle’s Shape Tells You
Every candle encodes four prices: open, high, low, and close. The “body” is the range between open and close, and its color shows direction — a bullish body means the close was higher than the open, a bearish body means the opposite. The “wicks” (or shadows) above and below the body show the full range price traveled during that period, including the parts that later reversed.
A large body relative to its wicks shows conviction — one side controlled the period from start to finish. A small body with long wicks shows indecision — price traveled a long way in both directions but ended up close to where it started, meaning neither buyers nor sellers won outright.
The Doji
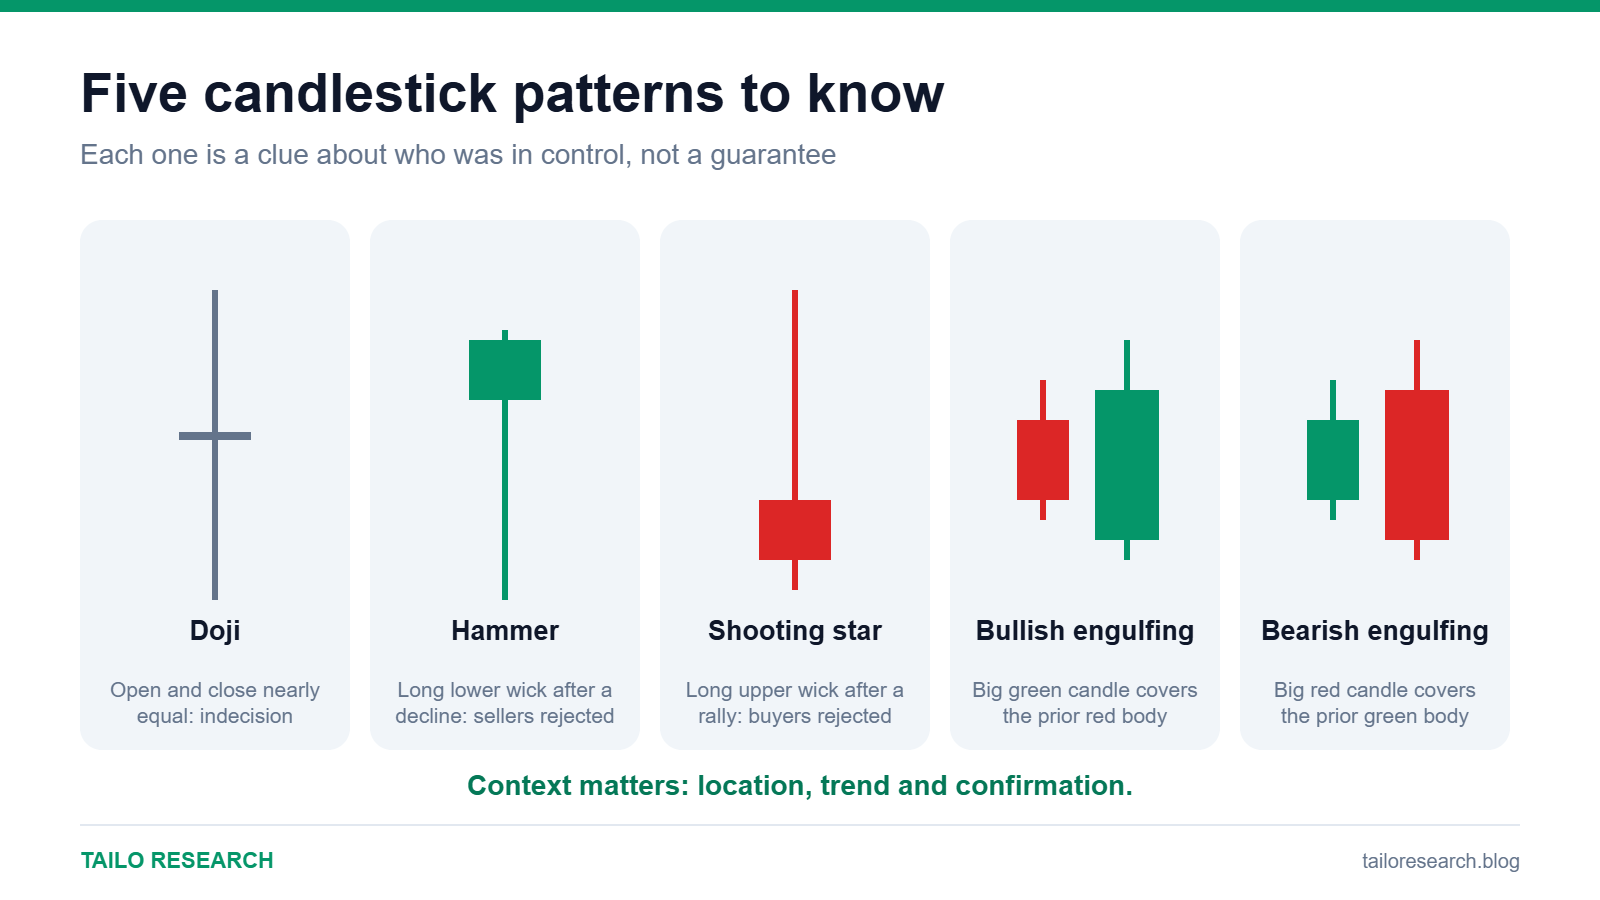
A doji forms when a candle’s open and close are virtually identical, producing a tiny or nonexistent body with wicks on one or both sides — the April 2 and 3 candles in the chart above are good examples. On their own, doji candles simply mean the market couldn’t decide on a direction during that period. Their significance comes almost entirely from location: a doji appearing after a strong, extended trend is a much more meaningful warning sign than one appearing in the middle of a sideways range, where indecision is the norm anyway.
The Hammer and Shooting Star
A hammer has a small body near the top of its range with a long lower wick — at least roughly twice the length of the body — and little to no upper wick. It forms after a decline and signals that sellers pushed price sharply lower during the period, but buyers stepped in hard enough to reclaim most of the ground by the close. The March 31 candle in the chart above fits this shape closely.
A shooting star is the mirror image: a small body near the bottom of its range with a long upper wick, forming after an advance. It suggests buyers pushed price higher intraday, only for sellers to take control and drag the close back down — an early warning that upward momentum may be fading.
Engulfing Patterns
An engulfing pattern is a two-candle formation. A bullish engulfing candle opens below (or near) the prior candle’s close and closes above the prior candle’s open, so its body completely “engulfs” the smaller body before it — a strong signal that buyers have decisively overwhelmed the prior selling pressure. A bearish engulfing candle is the mirror image, engulfing a prior bullish candle and suggesting sellers have taken firm control.
The larger the engulfing candle relative to the one it swallows, and the more established the prior trend it’s reversing, the more weight the pattern tends to carry.
Why Location Matters More Than Shape
The single biggest mistake beginners make with candlestick patterns is treating the shape as the whole signal. A hammer that forms in the middle of a trading range, far from any meaningful level, tells you far less than a hammer that forms exactly at a well-tested support zone after an extended decline. The pattern itself is really just a snapshot of buyer/seller conviction during one period — its predictive value comes from combining that snapshot with where it occurs and what came before it.
- A reversal candle at a well-established support or resistance level carries far more weight than the same shape appearing at a random price.
- A reversal candle landing near a key Fibonacci retracement level adds another layer of confluence.
- Checking whether RSI is oversold or overbought at the same time as the pattern helps confirm whether momentum genuinely supports a reversal.
- A reversal candle that also breaks a short-term trendline or crosses a key moving average adds further confirmation beyond the candle shape alone.
Common Mistakes to Avoid
- Trading the pattern in isolation, without checking the surrounding structure, trend, or nearby support/resistance.
- Acting before the candle closes — a candle can look like a hammer intraday and finish the session looking completely different.
- Over-fitting shapes to noisy, low-timeframe charts, where random price wiggles produce plenty of “patterns” that carry little real significance.
- Ignoring volume, when available — a reversal candle on unusually high volume is generally more convincing than the same shape on quiet, thin trading.
Candlestick patterns won’t hand you a guaranteed signal, but learning to read what a candle’s shape says about the underlying fight between buyers and sellers — and combining that with the surrounding context — turns raw price action into genuinely useful information.
For related reading, see our guides to Support and Resistance Levels, Fibonacci Retracement, RSI, and Moving Averages.
If you want to put these candlestick concepts into practice, Vantage Markets gives you access to NAS100 and other major markets with competitive spreads and fast execution. Open a free Vantage Markets account and start applying what you’ve learned.
This content is for informational and educational purposes only and does not constitute financial advice. Trading CFDs carries a high level of risk and may not be suitable for all investors. Past performance is not indicative of future results. Please read our full Risk Disclaimer and Affiliate Disclosure before making any trading decisions.


Leave a Reply