

Candlestick charts are the standard way traders look at price. Each candle packs four numbers into a single shape, and once you can read those shapes, a chart tells a story about who was in control: buyers or sellers. This guide covers the anatomy of a candle, the patterns worth learning and the context that makes them useful.
The anatomy of a candlestick
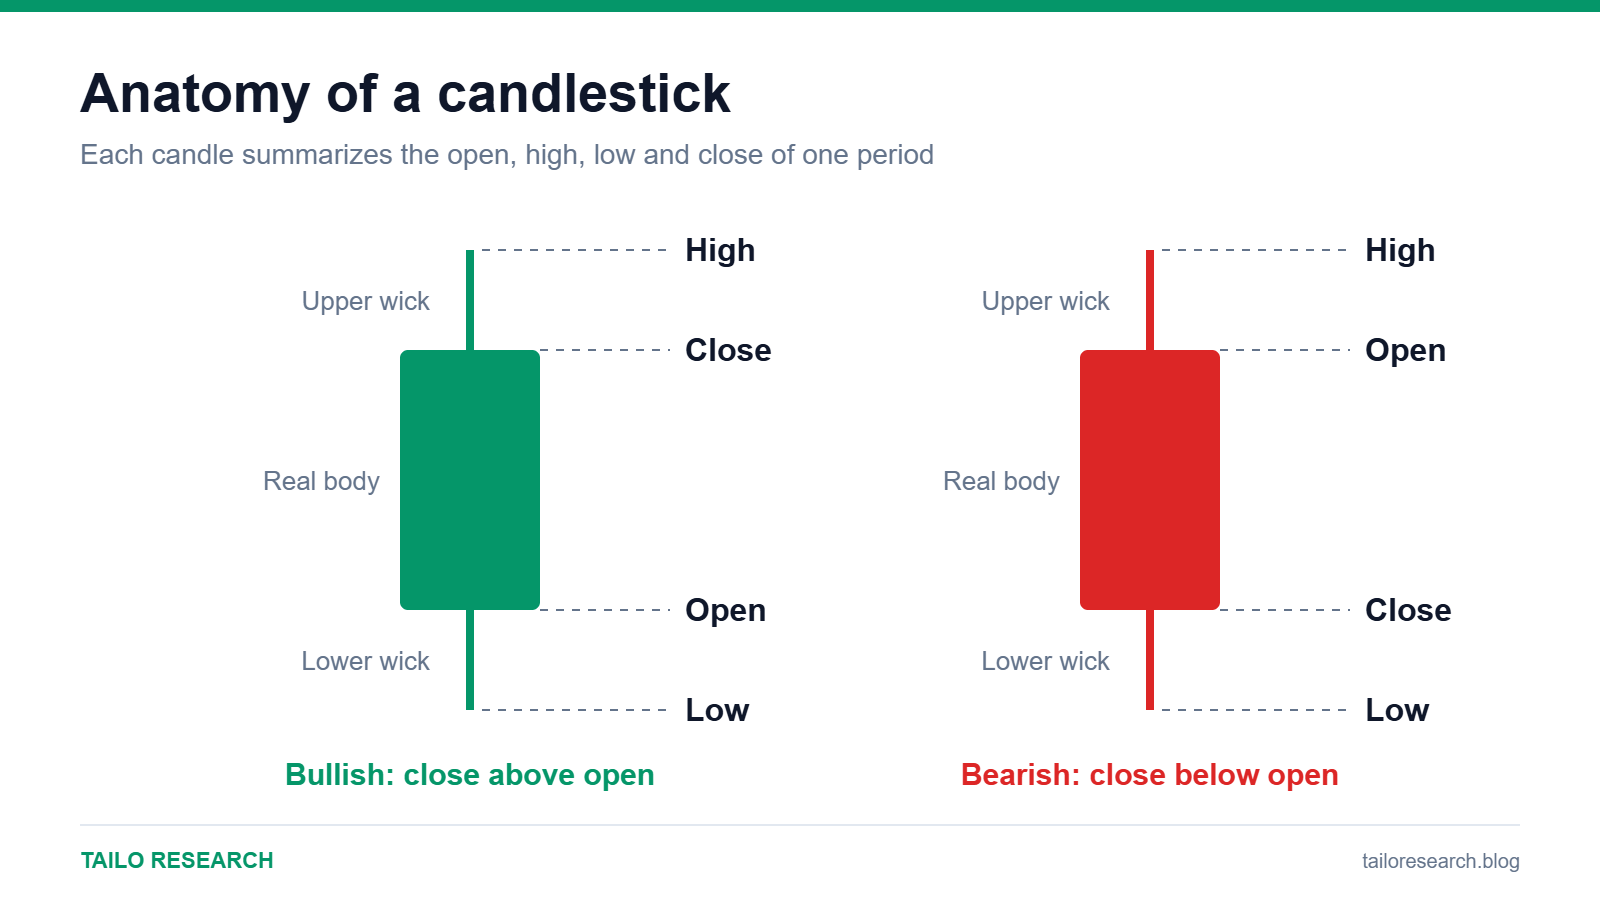
Every candle shows four prices for the period it covers (one minute, one hour, one day and so on):
- Open: the first traded price of the period
- High: the highest price reached
- Low: the lowest price reached
- Close: the last traded price of the period
The thick part is the body, drawn between the open and the close. The thin lines above and below are the wicks (also called shadows) and mark the high and low. On most charts a green or white candle means the price closed above its open, and a red or black candle means it closed below.
What bodies and wicks tell you
- Long body: one side dominated the period. A long green body means buyers pushed price up with little resistance.
- Small body: indecision. Buyers and sellers roughly balanced.
- Long upper wick: buyers pushed price up but sellers rejected the highs.
- Long lower wick: sellers pushed price down but buyers rejected the lows.
Timeframes matter
A candle on a daily chart summarizes a full day of trading, while a 5-minute candle summarizes five minutes. Patterns on higher timeframes (daily, weekly) carry more weight than those on lower timeframes because more trading activity stands behind them. A common habit is to identify direction and key levels on a higher timeframe, then look for entries on a lower one.
Candlestick patterns worth knowing
| Pattern | What it looks like | Typical reading | Needs confirmation |
|---|---|---|---|
| Doji | Open and close nearly equal, wicks on both sides | Indecision; possible pause or turn | Yes, next candle decides |
| Hammer | Small body on top, long lower wick, after a decline | Sellers rejected lower prices; possible bounce | Yes |
| Shooting star | Small body at the bottom, long upper wick, after a rally | Buyers rejected higher prices; possible pullback | Yes |
| Bullish engulfing | A large green candle that covers the prior red body | Buyers overwhelmed sellers | Yes |
| Bearish engulfing | A large red candle that covers the prior green body | Sellers overwhelmed buyers | Yes |
| Morning / evening star | Three-candle reversal around a small middle candle | Momentum shifting at a turn | Yes |
For a closer look at individual patterns such as the doji, hammer and engulfing candles, see our candlestick patterns guide.
Context is everything
A hammer in the middle of nowhere means very little. The same hammer forming on a well-tested price level, after a sharp decline, and on rising volume is much more meaningful. Before acting on any candlestick pattern, ask:
- Where is it? Is it forming at a known level? See our guide to support and resistance.
- What is the trend? Reversal patterns against a strong trend fail more often.
- What does volume say? Rising volume on the signal candle adds weight.
- What is my risk? Where would the idea be proven wrong, and can I place a stop there?
Common mistakes
- Trading every pattern regardless of location
- Ignoring the higher timeframe
- Acting before the candle closes, when it can still change shape
- Skipping the stop-loss because the pattern “looks obvious”
- Believing a pattern predicts the future rather than shifts probabilities
A simple way to practice
- Open a chart of a market you follow on a daily timeframe.
- Scroll back and mark 10 clear swing highs and lows.
- Note which candles formed at those turns and what happened next.
- Repeat on a different market and timeframe, and count how often patterns failed.
This routine builds pattern recognition and, more importantly, shows you how often patterns do not work. Candlesticks describe what has happened; they do not guarantee what happens next.
Key takeaways
- Each candle shows open, high, low and close.
- Bodies show control; wicks show rejection.
- Patterns are probabilities, and they work best at meaningful levels with confirmation.
Practice reading charts with a demo account on a platform that connects to TradingView? Open a Vantage account. This is an affiliate link: we may earn a commission at no extra charge from us. CFDs are complex instruments and carry a high risk of losing money rapidly due to leverage; most retail accounts lose money. See our Affiliate Disclosure and Risk Disclaimer.
Related reading
- Support and resistance: how to find key price levels
- How to analyze a stock
- Futures trading for beginners
Educational content only, not investment advice. Trading and investing involve risk, including the loss of your capital. Read our Risk Disclaimer and Affiliate Disclosure.


Leave a Reply