

Most technical indicators tell you one thing: momentum, volatility, or volume. The Ichimoku Cloud tries to tell you almost everything at once — trend direction, momentum, support and resistance, and a forward-looking projection of where that support and resistance will sit — all from a single chart. That ambition is exactly why so many beginners glance at an Ichimoku chart, see five overlapping lines and a shaded cloud, and click the indicator straight back off.
That reaction is understandable, but it’s also a missed opportunity. Once you understand what each of the five components is actually measuring, the “cloud” stops looking like clutter and starts looking like what it was designed to be: a complete trend-following system that fits on one chart. This guide breaks down each component, explains how they work together, and shows how to read the cloud using real NAS100 chart examples — without turning this into a math lecture.
What Is the Ichimoku Cloud, Exactly?
The Ichimoku Cloud — more formally Ichimoku Kinko Hyo, Japanese for “one glance equilibrium chart” — was developed by Goichi Hosoda, a Japanese journalist who published under the pen name Ichimoku Sanjin. Hosoda began working on the concept in the late 1930s and spent roughly three decades refining it with the help of a team of assistants before publishing the method in book form in the late 1960s. The goal was exactly what the name promises: to condense trend, momentum, and support/resistance into a chart a trader could read “at a glance,” without stacking multiple separate indicators underneath the price panel.
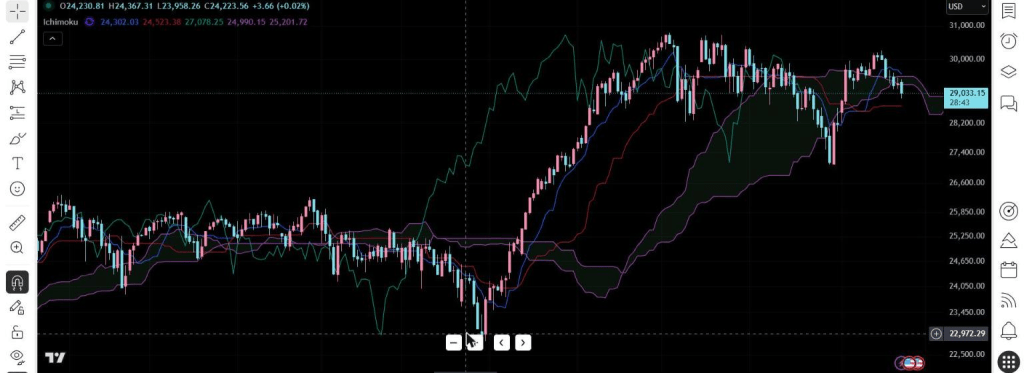
Unlike RSI or MACD, which sit in their own panel below the price, Ichimoku is plotted directly on the price chart itself. That’s part of what makes it feel dense at first — you’re looking at price plus five additional lines in the same space. But those five lines aren’t arbitrary; each one answers a specific question about the market.
The Five Lines That Make Up Ichimoku
Every Ichimoku component is built from the same basic building block Hosoda relied on throughout: the midpoint between the highest high and the lowest low over a given lookback period. The five components differ only in their lookback period and how far forward or backward they’re shifted.
- Tenkan-sen (Conversion Line) — the midpoint of the highest high and lowest low over the last 9 periods. This is the fastest-moving line, roughly comparable to a short-term moving average.
- Kijun-sen (Base Line) — the same calculation over the last 26 periods. Slower and steadier than the Tenkan-sen, it acts as a medium-term trend reference and is often watched as dynamic support or resistance on its own.
- Senkou Span A (Leading Span A) — the midpoint of the Tenkan-sen and Kijun-sen, plotted 26 periods into the future. This is one edge of the cloud.
- Senkou Span B (Leading Span B) — the midpoint of the highest high and lowest low over the last 52 periods, also plotted 26 periods into the future. This is the cloud’s other edge.
- Chikou Span (Lagging Span) — simply the current closing price, plotted 26 periods into the past.
The space between Senkou Span A and Senkou Span B is shaded in — that shaded area is the “cloud,” or kumo. Because both spans are projected 26 periods forward, the cloud extends ahead of current price, giving you a preview of where support and resistance are likely to sit in the near future, not just where they’ve been.
Reading the Cloud: Trend, Support, and Resistance
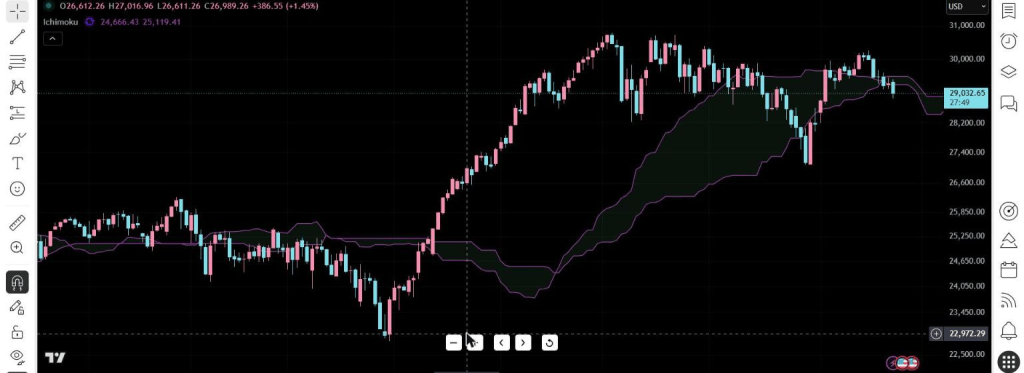
The most basic read of an Ichimoku chart comes from a single question: where is price relative to the cloud?
- Price above the cloud generally signals an uptrend. The cloud itself acts as a support zone on pullbacks.
- Price below the cloud generally signals a downtrend. The cloud acts as a resistance zone on rallies.
- Price inside the cloud signals a range or a transitional, indecisive phase — the market hasn’t committed to a clear direction.
The cloud’s color and thickness add a second layer of information. When Senkou Span A sits above Senkou Span B, the cloud is typically shaded in a bullish color (often green) and reinforces an uptrend; when Span B sits above Span A, it’s shaded bearish (often red). A thick cloud represents a wide historical trading range being projected forward, meaning stronger support or resistance that’s more likely to hold. A thin cloud represents weaker, less convincing support or resistance — one that price is more likely to punch straight through.
The TK Cross: Ichimoku’s Version of a Crossover Signal
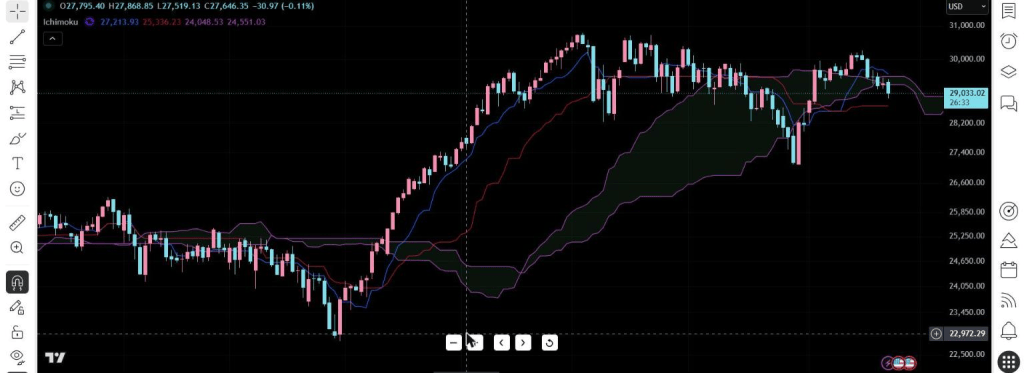
The Tenkan-sen and Kijun-sen function similarly to a fast and slow moving average, and their crossover — known as the TK Cross — is one of Ichimoku’s most-watched signals.
Bullish TK Cross: the Tenkan-sen crosses above the Kijun-sen. This is read as a stronger signal when it happens with price already trading above the cloud, since all three elements — Tenkan-sen, Kijun-sen, and price — are aligned in the same bullish direction.
Bearish TK Cross: the Tenkan-sen crosses below the Kijun-sen. This carries more weight when it occurs with price already below the cloud.
A TK Cross that happens inside the cloud, or against the direction of the broader cloud trend, is a weaker signal and more prone to failing — this is one of the most common places beginners get caught, treating every crossover as equally tradable regardless of where it happens relative to the cloud.
The Kumo Twist: When the Cloud Itself Changes Its Mind
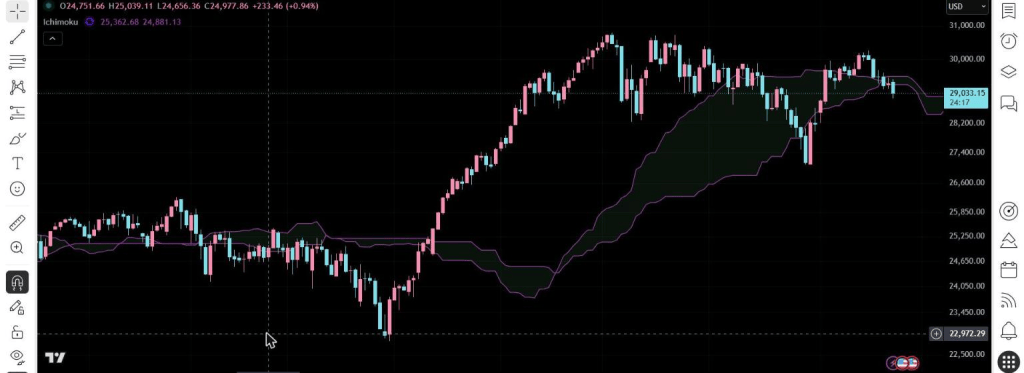
Because Senkou Span A and Senkou Span B are both projected 26 periods forward, you can actually see a change in the cloud’s underlying bias before price gets there. When Span A crosses Span B — flipping the cloud’s color — that’s called a kumo twist, and it signals a potential shift in the market’s longer-term equilibrium.
A twist from bearish to bullish (Span A crossing above Span B) suggests the balance of power is shifting toward buyers going forward. A twist from bullish to bearish suggests the opposite. Because the cloud is projected ahead of price, a kumo twist sitting just in front of current price is often treated as an early warning that the current support or resistance zone is about to change character — worth watching closely rather than trading on its own.
The Chikou Span: The Confirmation Most Beginners Skip
The Chikou Span — current price plotted 26 periods back — is easy to overlook, but it’s a useful confirmation tool precisely because it compares price now to price 26 periods ago in a single glance.
Bullish confirmation: the Chikou Span is above the price candles from 26 periods earlier, meaning current price is higher than it was then — a straightforward way of confirming upward momentum is intact, especially if the Chikou Span is also clear of resistance from that earlier price action.
Bearish confirmation: the Chikou Span is below the price candles from 26 periods earlier, confirming downward momentum.
Traders sometimes call this the “true strength” line: it’s less about predicting the future and more about verifying that a trend signal from the other four components is actually backed by real price displacement, not just a marginal move.
Common Beginner Mistakes with Ichimoku
Ichimoku’s biggest strength — combining five signals into one view — is also where most beginners go wrong.
- Trying to use every line at once. Reading Tenkan-sen, Kijun-sen, the cloud, and the Chikou Span all simultaneously on every candle is overwhelming and unnecessary early on. Start with cloud position and the TK Cross; layer in the Chikou Span and kumo twists once those feel intuitive.
- Ignoring that it’s a lagging system. Like most trend-following tools, Ichimoku is built from past price data. It’s excellent at confirming and riding an established trend, but it will not reliably call a top or bottom in advance.
- Using default settings on every timeframe without question. The 9-26-52 defaults were calibrated for a six-day Japanese trading week decades ago. They still work reasonably well on daily charts, but on very short timeframes the signals can become noisy and produce more false setups.
- Treating a TK Cross as tradable regardless of context. As covered above, a crossover’s reliability depends heavily on where it happens relative to the cloud — signals aligned with the broader cloud trend carry far more weight than ones that fight it.
Putting It Together: A Simple Reading Order
Given how much information is packed into one chart, a practical approach for a beginner is to build the habit of reading Ichimoku in a consistent order rather than trying to absorb everything at once:
- Check where price sits relative to the cloud — above, below, or inside — to establish the broader trend bias.
- Note the cloud’s color and thickness ahead of price, since that previews where support or resistance is likely to sit next.
- Look for a TK Cross, and weigh it more heavily when it agrees with the cloud trend.
- Confirm with the Chikou Span — is it clear of past price action in the direction of the signal?
- Watch for an upcoming kumo twist, which can flag that the picture is about to change.
Key Takeaways for Beginners
The Ichimoku Cloud isn’t five separate indicators bolted together — it’s one integrated system where trend, momentum, and forward-looking support/resistance all come from the same underlying calculation. It rewards patience: the components make far more sense once you’ve watched a handful of real TK crosses, kumo twists, and Chikou Span confirmations play out on an actual chart than they ever will from a definition alone.
Like any trend-following tool, Ichimoku works best as one part of a broader read on the market rather than a standalone signal generator, and it’s most reliable when its components agree with each other rather than when you’re cherry-picking the one line that supports the trade you already wanted to make.
For related reading, see our guides to the RSI indicator , Moving Averages (SMA and EMA), MACD, and Bollinger Bands, Support and Resistance, Fibonacci Retracement, Candlestick Patterns, Chart Patterns, and Risk Management.
If you want to put these Ichimoku Cloud concepts into practice, Vantage Markets gives you access to NAS100 and other major markets with competitive spreads and fast execution. Open a free Vantage Markets account and start applying what you’ve learned.
This content is for informational and educational purposes only and does not constitute financial advice. Trading CFDs carries a high level of risk and may not be suitable for all investors. Past performance is not indicative of future results. Please read our full Risk Disclaimer and Affiliate Disclosure before making any trading decisions.


Leave a Reply