

Fibonacci retracement is one of the more polarizing tools in a trader’s kit — some swear by it, others dismiss it as glorified pattern-matching. The truth sits in between: Fibonacci levels aren’t magic, but they mark price zones where a genuinely large number of traders are watching and placing orders, which is often enough to make them self-fulfilling in the short term. Used with the right context, they’re a useful way to anticipate where a pullback might pause before a trend resumes.
This guide explains where the Fibonacci ratios come from, how to draw a retracement correctly, which levels matter most in practice, and how to combine Fibonacci with other tools rather than trading it in isolation.
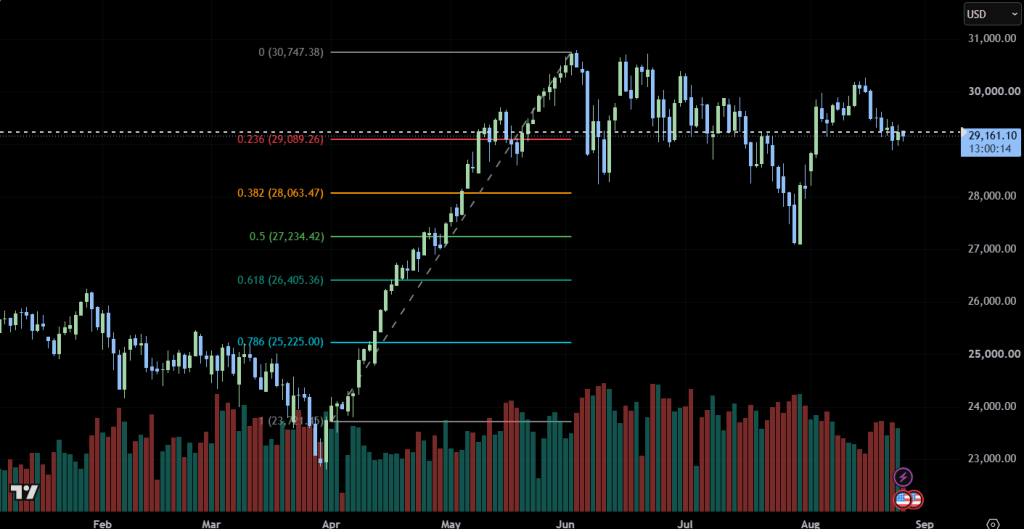
The chart above shows NAS100 on the daily timeframe, with a Fibonacci retracement drawn from the April swing low (23,741.65) to the June swing high (30,747.38). Notice how price pulled back into the 0.236–0.382 zone (roughly 29,090–28,060) multiple times over July and August before continuing to chop around that area — a textbook example of the tool marking a zone worth watching, even though price didn’t stop at one exact number.
Where the Fibonacci Ratios Come From
The Fibonacci sequence (0, 1, 1, 2, 3, 5, 8, 13, 21…) has a property where dividing a number by the one after it converges toward 0.618, and dividing it by the one two places after it converges toward 0.382. Traders adapted these ratios — along with 0.236, 0.5, and 0.786 — into “retracement levels” that mark how far price might pull back after a strong move, expressed as a percentage of that move.
Whether or not the math has any deep connection to market behavior is a genuinely debated question. What isn’t debatable is that enough traders, institutions, and algorithms watch these specific levels that they can become areas of real order concentration — which is the actual reason they tend to matter, regardless of the underlying theory.
How to Draw a Fibonacci Retracement Correctly
Getting the anchor points right matters more than any other part of using this tool:
- Identify a clear, significant swing — a definitive low and high (or high and low, in a downtrend) rather than a minor wiggle.
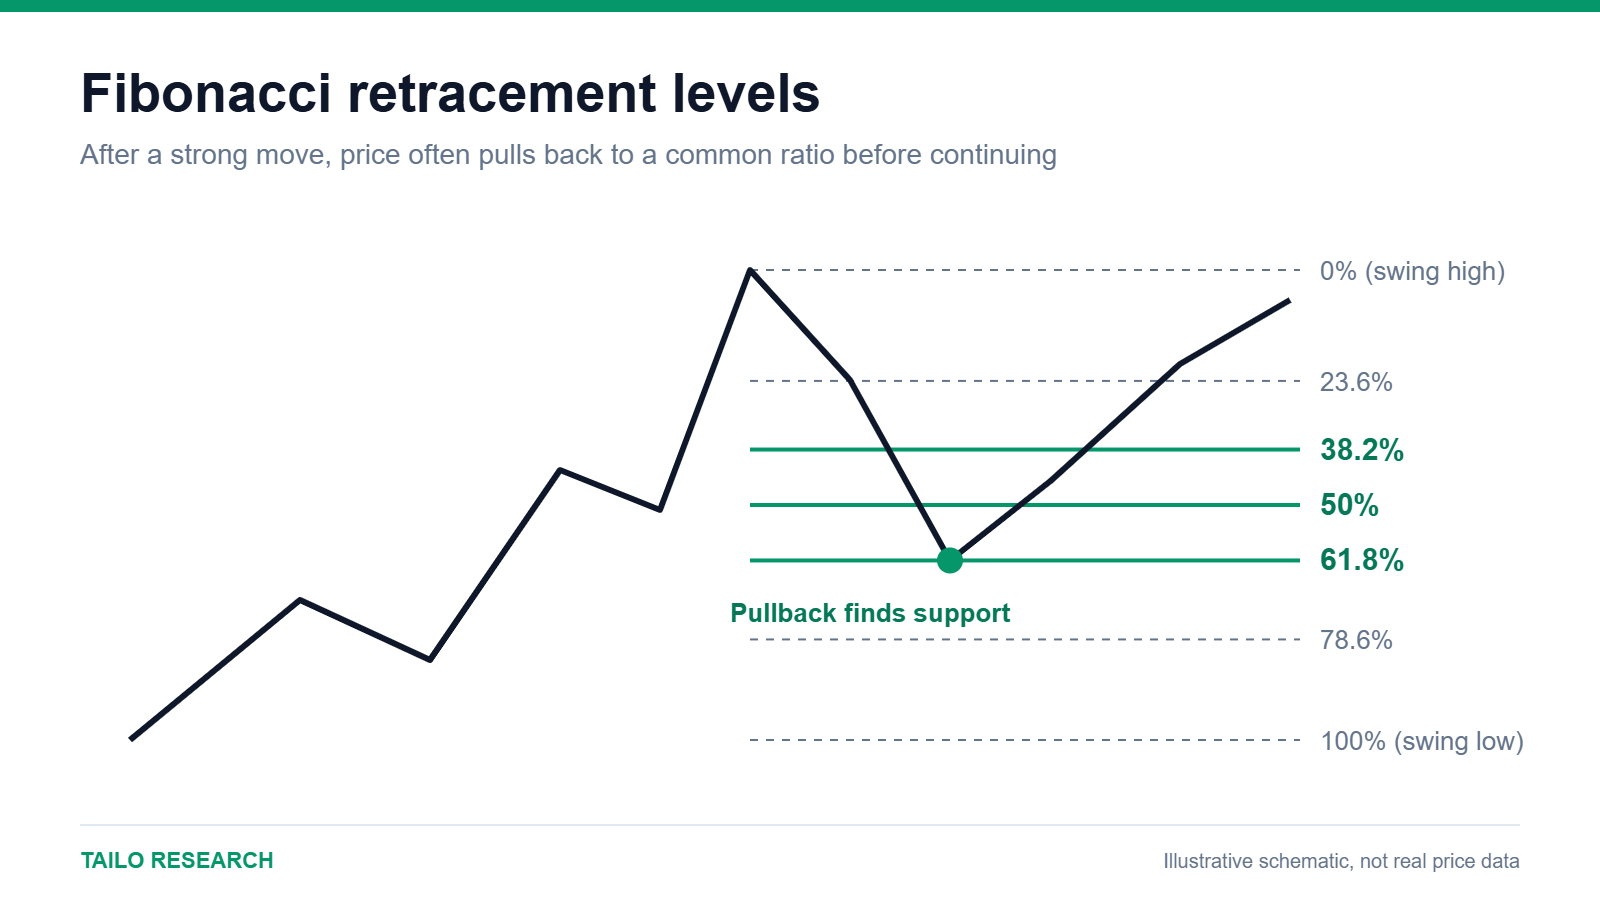
- In an uptrend, drag the tool from the swing low to the swing high; the retracement levels will then sit below the high, marking potential pullback zones.
- In a downtrend, drag from the swing high to the swing low instead, so the levels sit above the low, marking potential zones for a corrective bounce.
- Use a clean, obvious swing on a higher timeframe (daily or above) rather than a minor swing on a 5-minute chart — the more significant the swing, the more traders are likely watching the same levels.
A common beginner error is anchoring the tool to the wrong points — a mid-move high instead of the actual swing extreme, for example — which shifts every level and makes the whole read unreliable.
Which Levels Matter Most
Not all Fibonacci levels carry equal weight in practice:
- 0.382 and 0.5: shallow pullback zone, often seen in strong trends where the underlying momentum barely pauses before continuing.
- 0.618: widely referred to as the “golden ratio” level and arguably the most closely watched retracement level across all markets — a common area for trend-continuation entries.
- 0.786: a deeper pullback that starts to raise the question of whether the original trend is still intact or whether the move is turning into a full reversal.
- 1.0: a full retracement back to the starting point, at which stage the “pullback” label often stops being useful and the move should probably be treated as a new trend in the opposite direction.
Many traders treat the 0.5–0.618 zone as the “sweet spot” for continuation entries — deep enough to offer a reasonable risk/reward, but shallow enough that the original trend is still statistically more likely to be intact than not.
Fibonacci Extensions vs. Retracements
Retracements measure how far price might pull back within a completed move. Extensions are a related but different tool — they project how far price might travel beyond the original move, using levels like 1.272, 1.618, and 2.0. Traders often use retracements to plan entries into a pullback, then switch to extensions to set realistic profit targets once the trend resumes, rather than guessing at a round number.
Combining Fibonacci With Other Tools
Fibonacci levels are considerably more useful when they line up with other forms of confirmation rather than being traded on their own:
- Checking whether a Fibonacci level lines up with a prior support or resistance zone — this kind of confluence significantly increases a level’s reliability.
- Watching RSI for oversold or overbought readings as price reaches a key retracement level, to help judge whether the pullback has room to continue.
- Using a moving average that happens to sit near the same Fibonacci level as extra confirmation of a genuine support or resistance zone.
- Watching for a MACD crossover as price reacts at a Fibonacci level, to help confirm that momentum is turning back in the direction of the original trend.
Common Mistakes to Avoid
- Anchoring to the wrong swing points — using a minor wiggle instead of the actual significant high or low, which throws off every level that follows.
- Treating every level as a hard floor or ceiling instead of a zone where a reaction is more likely, not guaranteed.
- Drawing Fibonacci on every swing you see until the chart is cluttered with overlapping levels that no longer mean anything specific.
- Ignoring the broader trend and trading a retracement level in isolation, without checking whether the larger structure still supports the trade.
Fibonacci retracement won’t predict the market with mathematical certainty, but drawn correctly on a meaningful swing and combined with other confirmation, it gives you a genuinely useful map of where a pullback is statistically more likely to find support or resistance.
For related reading, see our guides to Support and Resistance Levels, RSI, MACD, and Moving Averages.
If you want to put these Fibonacci concepts into practice, Vantage Markets gives you access to NAS100 and other major markets with competitive spreads and fast execution. Open a free Vantage Markets account and start applying what you’ve learned.
This content is for informational and educational purposes only and does not constitute financial advice. Trading CFDs carries a high level of risk and may not be suitable for all investors. Past performance is not indicative of future results. Please read our full Risk Disclaimer and Affiliate Disclosure before making any trading decisions.


Leave a Reply