

Moving averages are among the oldest and most widely used tools in technical analysis. They smooth out short-term price noise so traders can see the underlying trend more clearly, and they show up in nearly every strategy — from simple trend-following systems to complex algorithmic models. If you’ve looked at almost any price chart, you’ve already seen one: that smooth, curving line weaving through the candlesticks.
What Is a Simple Moving Average (SMA)?
A Simple Moving Average (SMA) takes the closing prices of the last N candles, adds them together, and divides by N. A 20-day SMA on a daily chart, for example, is just the average closing price of the last 20 trading days. As each new candle closes, the oldest price drops off the calculation and the newest one is added, so the average line “moves” forward with the price.
Because every price in the lookback period is weighted equally, the SMA reacts slowly and smoothly to new price action. This makes it excellent at revealing the broad, underlying trend, but it also means it lags — sometimes significantly — behind the current price, especially over longer lookback periods.
What Is an Exponential Moving Average (EMA)?
An Exponential Moving Average (EMA) also averages recent closing prices, but it applies a weighting multiplier that gives more importance to the most recent candles. The multiplier is calculated as 2 ÷ (N + 1), so a 10-period EMA gives roughly 18% weight to the latest close, compared to just a few percent for the oldest price in the same lookback.
That extra weight on recent price makes the EMA hug price action more tightly and turn faster than an SMA of the same length. The tradeoff is that the EMA is also more prone to “whipsaws” — small, choppy moves that can trigger a turn in the line before a genuine trend change has actually happened.
SMA vs. EMA: Key Differences
The chart below plots NAS100 with a 20-period EMA (blue), a 50-period SMA (orange), and a 200-period SMA (red) over the same ten months. Notice how the blue EMA tracks the candles more closely through the April rally and the August pullback, while the orange and red SMAs move in smoother, wider arcs.

Golden Cross and Death Cross: What Moving Average Crossovers Mean
One of the most widely referenced moving average signals is the crossover between a shorter-term and a longer-term average. A Golden Cross occurs when a shorter-term moving average, commonly the 50-period, crosses above a longer-term moving average, commonly the 200-period. Traders view this as a signal that momentum has turned bullish enough to potentially reverse or extend a longer-term uptrend. The opposite pattern, a Death Cross, happens when the shorter-term average crosses below the longer-term average, which is often read as a bearish signal.
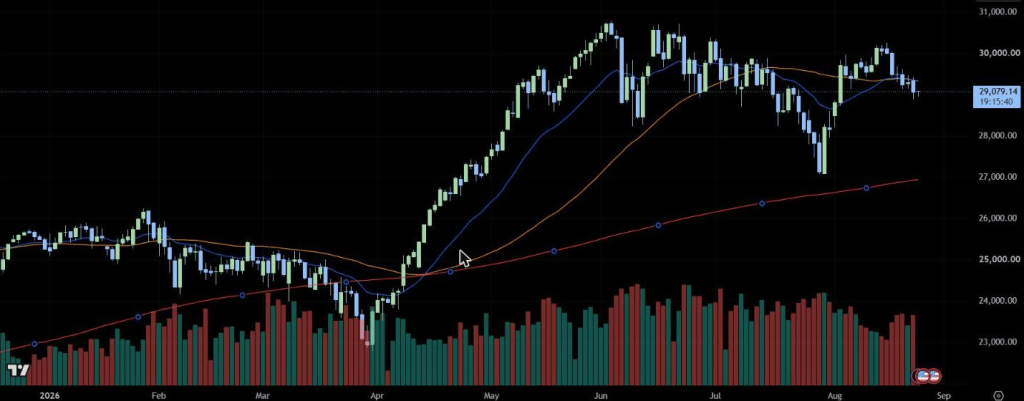
These crossovers are lagging by nature, since both averages are built from past prices, so the signal typically appears well after the actual trend change has already begun. That does not make them useless, but it does mean they work best as confirmation alongside other tools such as volume, momentum indicators, or price action, rather than as a standalone entry trigger. The chart below shows a clear Golden Cross on the NAS100 daily chart, where the 50-period SMA crosses above the 200-period SMA in early April, roughly coinciding with the start of a sustained rally.
EMA Responsiveness in Action
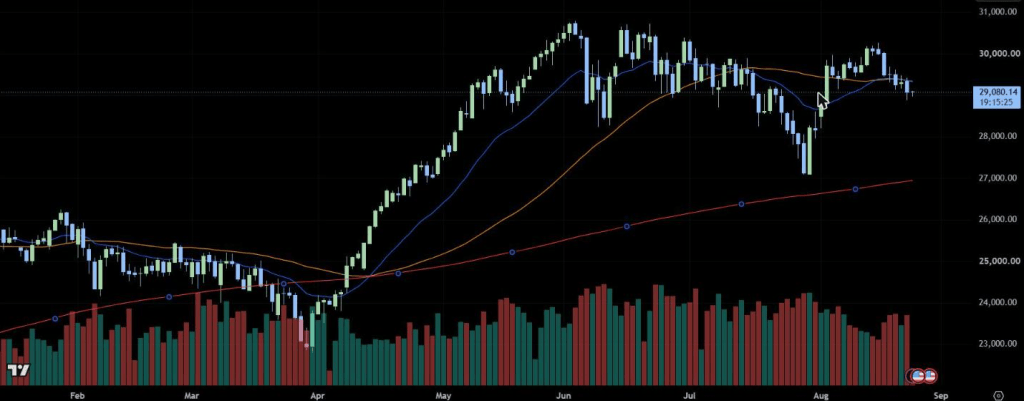
The theoretical difference between SMA and EMA becomes easier to see during a sharp, short-lived move. NAS100 saw exactly that kind of move in August, with a fast pullback followed by a quick recovery. During that stretch, the 20-period EMA bent downward almost immediately as prices fell, then curled back up as soon as buying resumed. The 50-period SMA, by contrast, barely reacted, continuing to drift in its prior direction because it was still weighted down by older price data from earlier in the month.
This is the core tradeoff between the two: the EMA gives traders an earlier read on short-term shifts, which can be valuable for tighter entries and exits, but that same sensitivity means it can also whipsaw during choppy, directionless price action. The SMA’s slower response filters out more of that noise, at the cost of reacting later to genuine changes in direction.
Moving Averages as Dynamic Support and Resistance
Beyond crossovers and trend confirmation, moving averages are also widely used as dynamic support and resistance levels. Unlike a fixed horizontal line drawn on a chart, a moving average shifts with price, so it acts as a sliding floor in an uptrend or a sliding ceiling in a downtrend. During a sustained trend, price will often pull back toward a moving average, find buyers or sellers there, and bounce, rather than breaking through it outright.
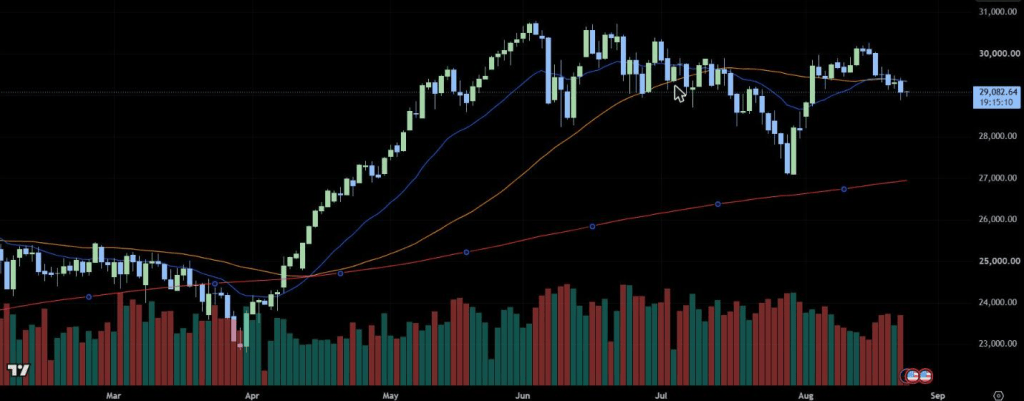
The chart below shows this behavior during a consolidation phase on NAS100 in June and July, where price repeatedly tests and holds above the 20-period EMA and 50-period SMA before continuing higher. Shorter moving averages, such as the 20-period EMA, tend to act as support during strong trends and get tested more frequently, while longer averages like the 50-period or 200-period SMA usually come into play during deeper pullbacks. As with crossovers, a bounce off a moving average is not guaranteed. It is a probability-based tendency, not a rule, and a strong break below a key average, especially on high volume, can signal that the trend is weakening.
Common Settings and How to Choose a Period
There is no single correct moving average length. The right period depends on the timeframe being traded and the type of signal being sought. Shorter periods such as the 9 or 20 are popular for identifying short-term momentum and are commonly applied as EMAs, since responsiveness matters most over such a short lookback. Medium periods such as the 50 are often used to gauge the intermediate trend and are a common SMA choice for spotting pullback entries. Longer periods such as the 100 or 200 are widely watched as a proxy for the broader, long-term trend, and the 200-period SMA in particular is one of the most closely followed levels across all markets, from individual stocks to major indices like NAS100.
A practical approach for beginners is to start with a small set, such as a 20-period EMA for short-term structure and a 50-period and 200-period SMA for the broader trend, and adjust from there based on how a specific market and timeframe behave.
Common Beginner Mistakes
A few habits trip up newer traders more than any other when it comes to moving averages.
- Treating every crossover as a trade signal. Golden and Death Crosses are lagging by design, and acting on every crossover without confirmation from price action or other indicators leads to chasing moves that have already largely played out.
- Using a single moving average in isolation. One average only tells part of the story. Pairing a short-term and a long-term average, or combining moving averages with a momentum indicator like RSI, gives a fuller picture than any single line can.
- Ignoring the timeframe mismatch. A 200-period SMA on a daily chart represents roughly 200 trading days, while the same 200-period SMA on a 5-minute chart covers only a few trading sessions. Applying settings from one timeframe to another without adjusting can produce misleading signals.
- Expecting moving averages to work in every market condition. Moving averages are trend-following tools, so they perform best in trending markets and tend to generate more false signals during sideways, range-bound conditions when price simply oscillates around the average without a clear direction.
Closing Thoughts
Moving averages remain one of the simplest and most versatile tools in technical analysis, useful for gauging trend direction, spotting potential entries and exits, and defining dynamic support and resistance. Like any indicator, they work best as part of a broader framework rather than in isolation, and understanding the tradeoffs between SMA and EMA is a foundational step toward reading price charts with more confidence.
For related reading, see our guides to the RSI indicator, the Ichimoku Cloud, MACD, and Bollinger Bands, Support and Resistance, Fibonacci Retracement, Candlestick Patterns, Chart Patterns, and Risk Management.
If you want to put these moving average concepts into practice, Vantage Markets gives you access to NAS100 and other major markets with competitive spreads and fast execution. Open a free Vantage Markets account and start applying what you’ve learned.
This content is for informational and educational purposes only and does not constitute financial advice. Trading CFDs carries a high level of risk and may not be suitable for all investors. Past performance is not indicative of future results. Please read our full Risk Disclaimer and Affiliate Disclosure before making any trading decisions.


Leave a Reply