

Some of the biggest moves in stocks, futures, bonds and crypto arrive at scheduled times: when inflation, jobs data or a central bank decision is released. Understanding what these events are and how markets interpret them helps you avoid being surprised, and helps you decide when to trade and when to stay out.
Why data moves prices: expectations vs reality
Markets do not react to whether a number is good or bad in absolute terms. They react to whether it is better or worse than expected. Analysts publish forecasts before every release, and prices already reflect those forecasts. When the actual figure differs from the consensus, prices adjust quickly. That gap is called the surprise.
The big three
1. CPI (Consumer Price Index)
CPI measures how prices for a basket of consumer goods and services change. In the US it is published monthly by the Bureau of Labor Statistics. Traders often focus on core CPI, which excludes food and energy, because it is less noisy. A higher-than-expected reading raises the odds that the central bank keeps rates high or raises them, which tends to pressure growth stocks and risk assets.
2. The jobs report (nonfarm payrolls)
The Employment Situation report is also published monthly by the Bureau of Labor Statistics, typically on the first Friday. It shows how many jobs were added, the unemployment rate and wage growth. Strong data suggests a resilient economy but can push rate expectations higher; weak data can raise recession worries or hopes for cuts, depending on the backdrop.
3. FOMC decisions
The Federal Open Market Committee sets the US policy interest rate and meets eight times a year. Markets watch three things: the rate decision itself, the written statement and the chair’s press conference. At some meetings the Fed also publishes updated economic projections, known as the dot plot. Changes in tone often move markets more than the decision itself.
Other releases worth watching
- PCE inflation: the Fed’s preferred inflation gauge
- GDP: overall economic growth
- ISM and PMI surveys: business activity and sentiment
- Retail sales: consumer spending
- Weekly jobless claims: a timely read on the labor market, released on Thursdays
How the reaction spreads across markets
- Data shifts expectations for interest rates.
- Bond yields and the US dollar adjust first.
- Rate-sensitive assets follow: growth and technology stocks, and indices such as the Nasdaq-100 tend to react strongly to changes in yields.
- Gold, crypto and commodities respond to the dollar, real yields and risk appetite.
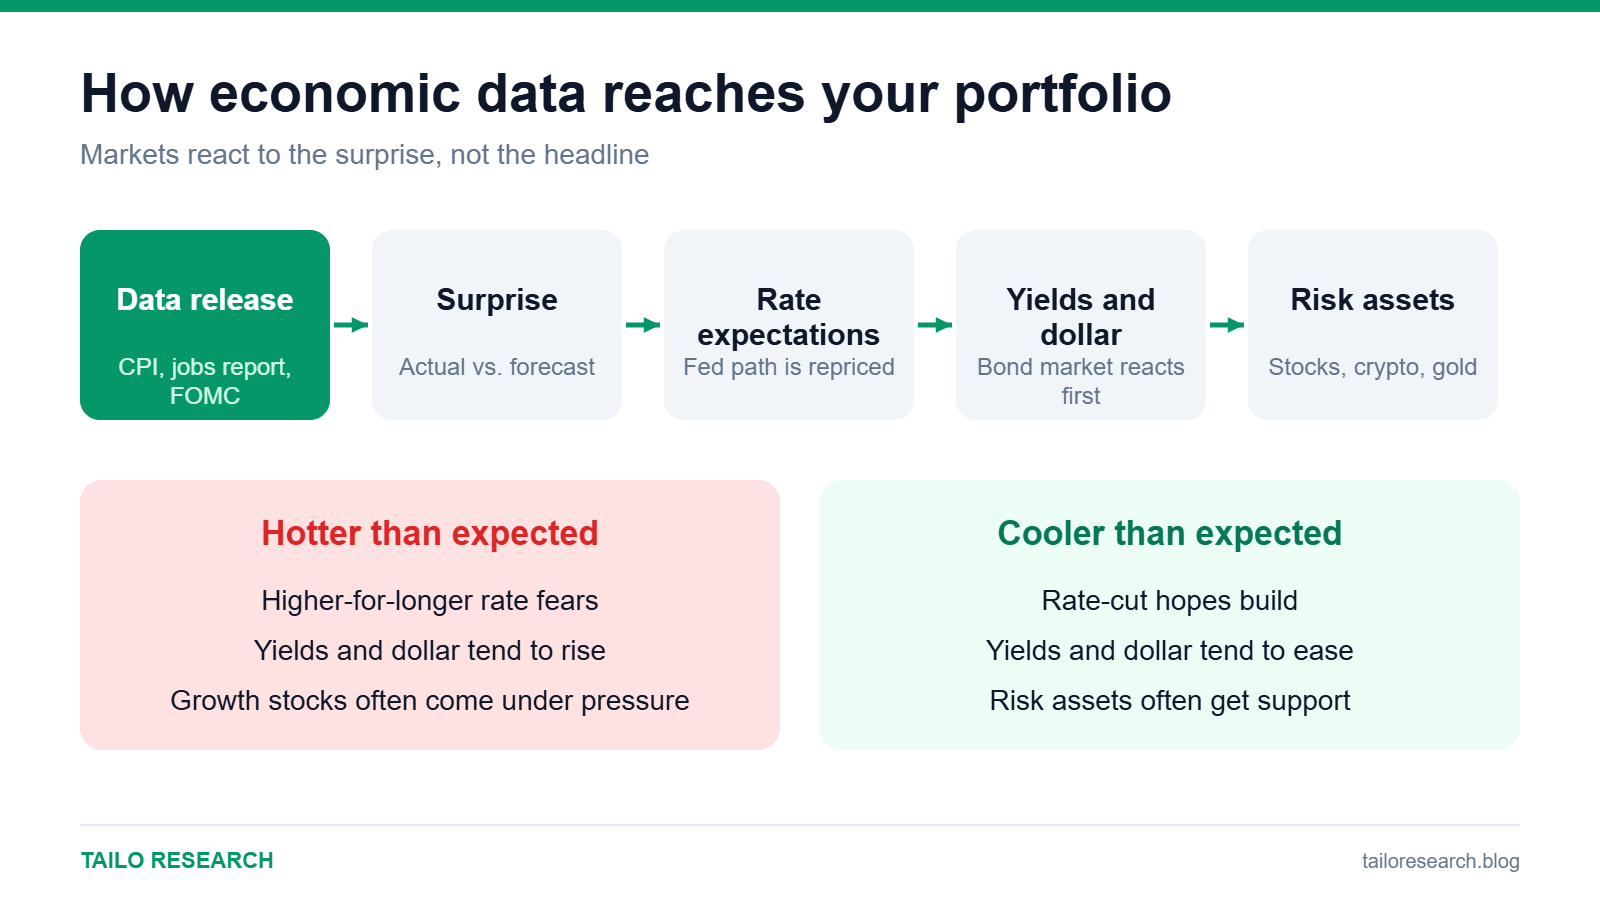
Sometimes good news is bad news for stocks, because strong data can mean higher rates for longer. The market’s reaction depends on what it was worried about beforehand.
What happens to trading conditions around releases
- Volatility spikes in the seconds and minutes after the release.
- Spreads widen and liquidity thins, so slippage rises.
- Prices can whip both ways before settling into a direction.
- Stops can be triggered by brief spikes.
How traders prepare
- Know the calendar: use official sources such as the Bureau of Labor Statistics and the Federal Reserve release schedules.
- Decide in advance: trade smaller, stay flat or wait for the first reaction to settle.
- Use your levels: mark support and resistance beforehand. See our guide to finding key levels.
- Mind your size: leveraged instruments such as MNQ futures can move quickly against you.
- Review afterward: note how the market behaved and compare with what you expected.
Key takeaways
- Markets react to surprises, not to headlines.
- CPI, jobs and FOMC are the most influential regular events.
- Volatility and spreads jump at release time, so plan your size and risk before the number prints.
Related reading
Educational content only, not investment advice. Trading and investing involve risk, including the loss of your capital. Read our Risk Disclaimer and Affiliate Disclosure.


Leave a Reply