

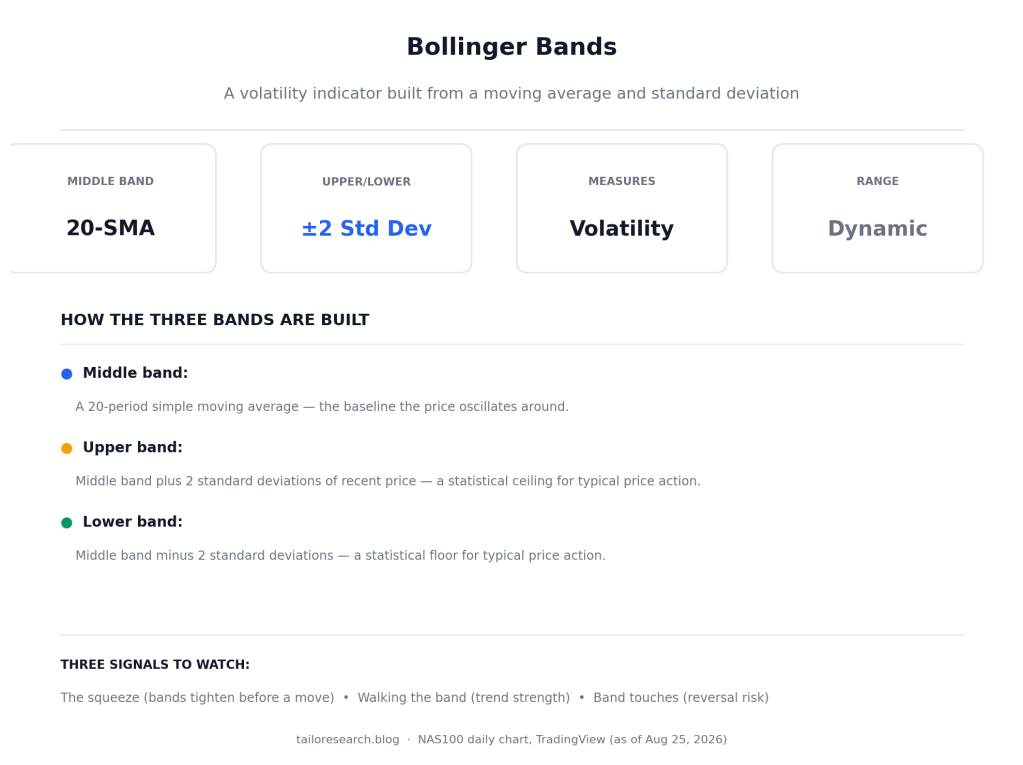
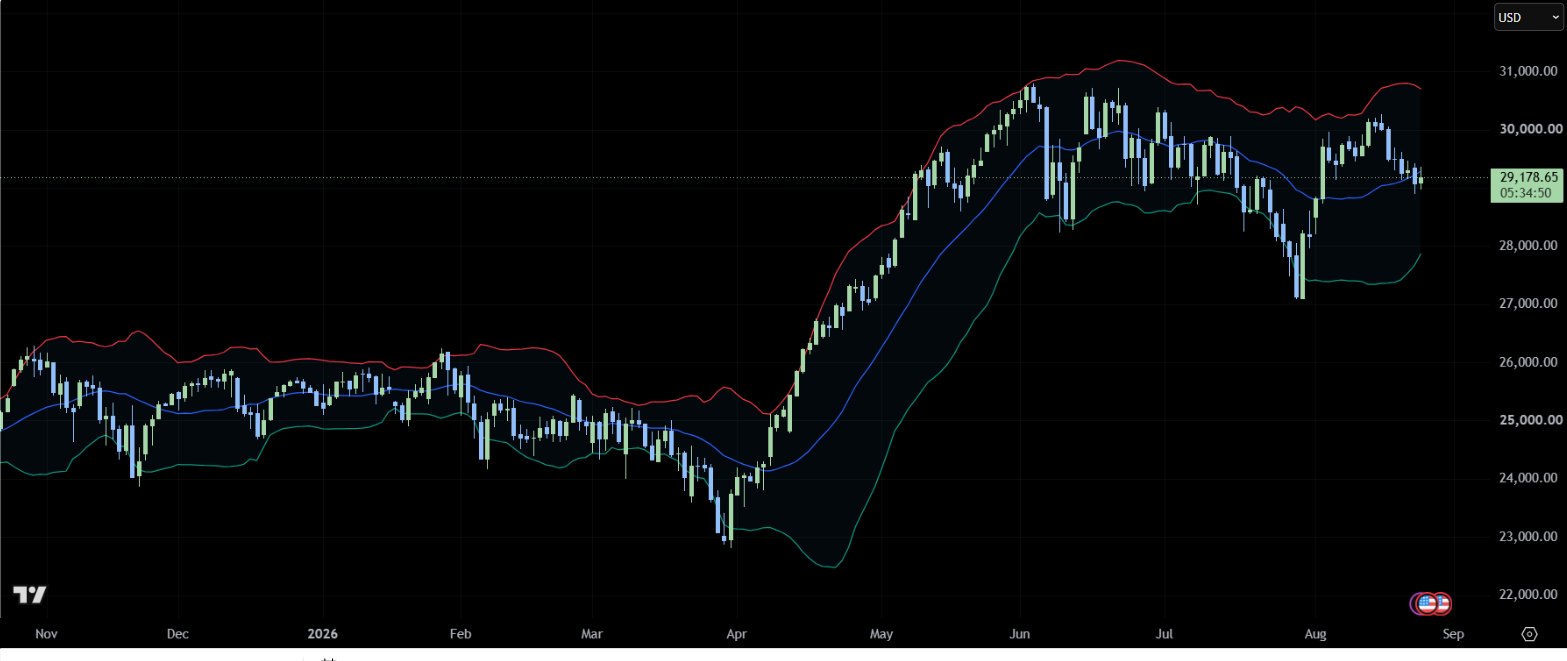
Bollinger Bands are one of the most widely used volatility indicators in trading, and for good reason: unlike a moving average or an oscillator that only tells you about direction or momentum, Bollinger Bands adapt in real time to how much a price is actually moving. When markets go quiet, the bands squeeze tight. When markets get volatile, they expand. That single property makes them useful for spotting both calm-before-the-storm setups and overextended moves.
How Bollinger Bands Are Built
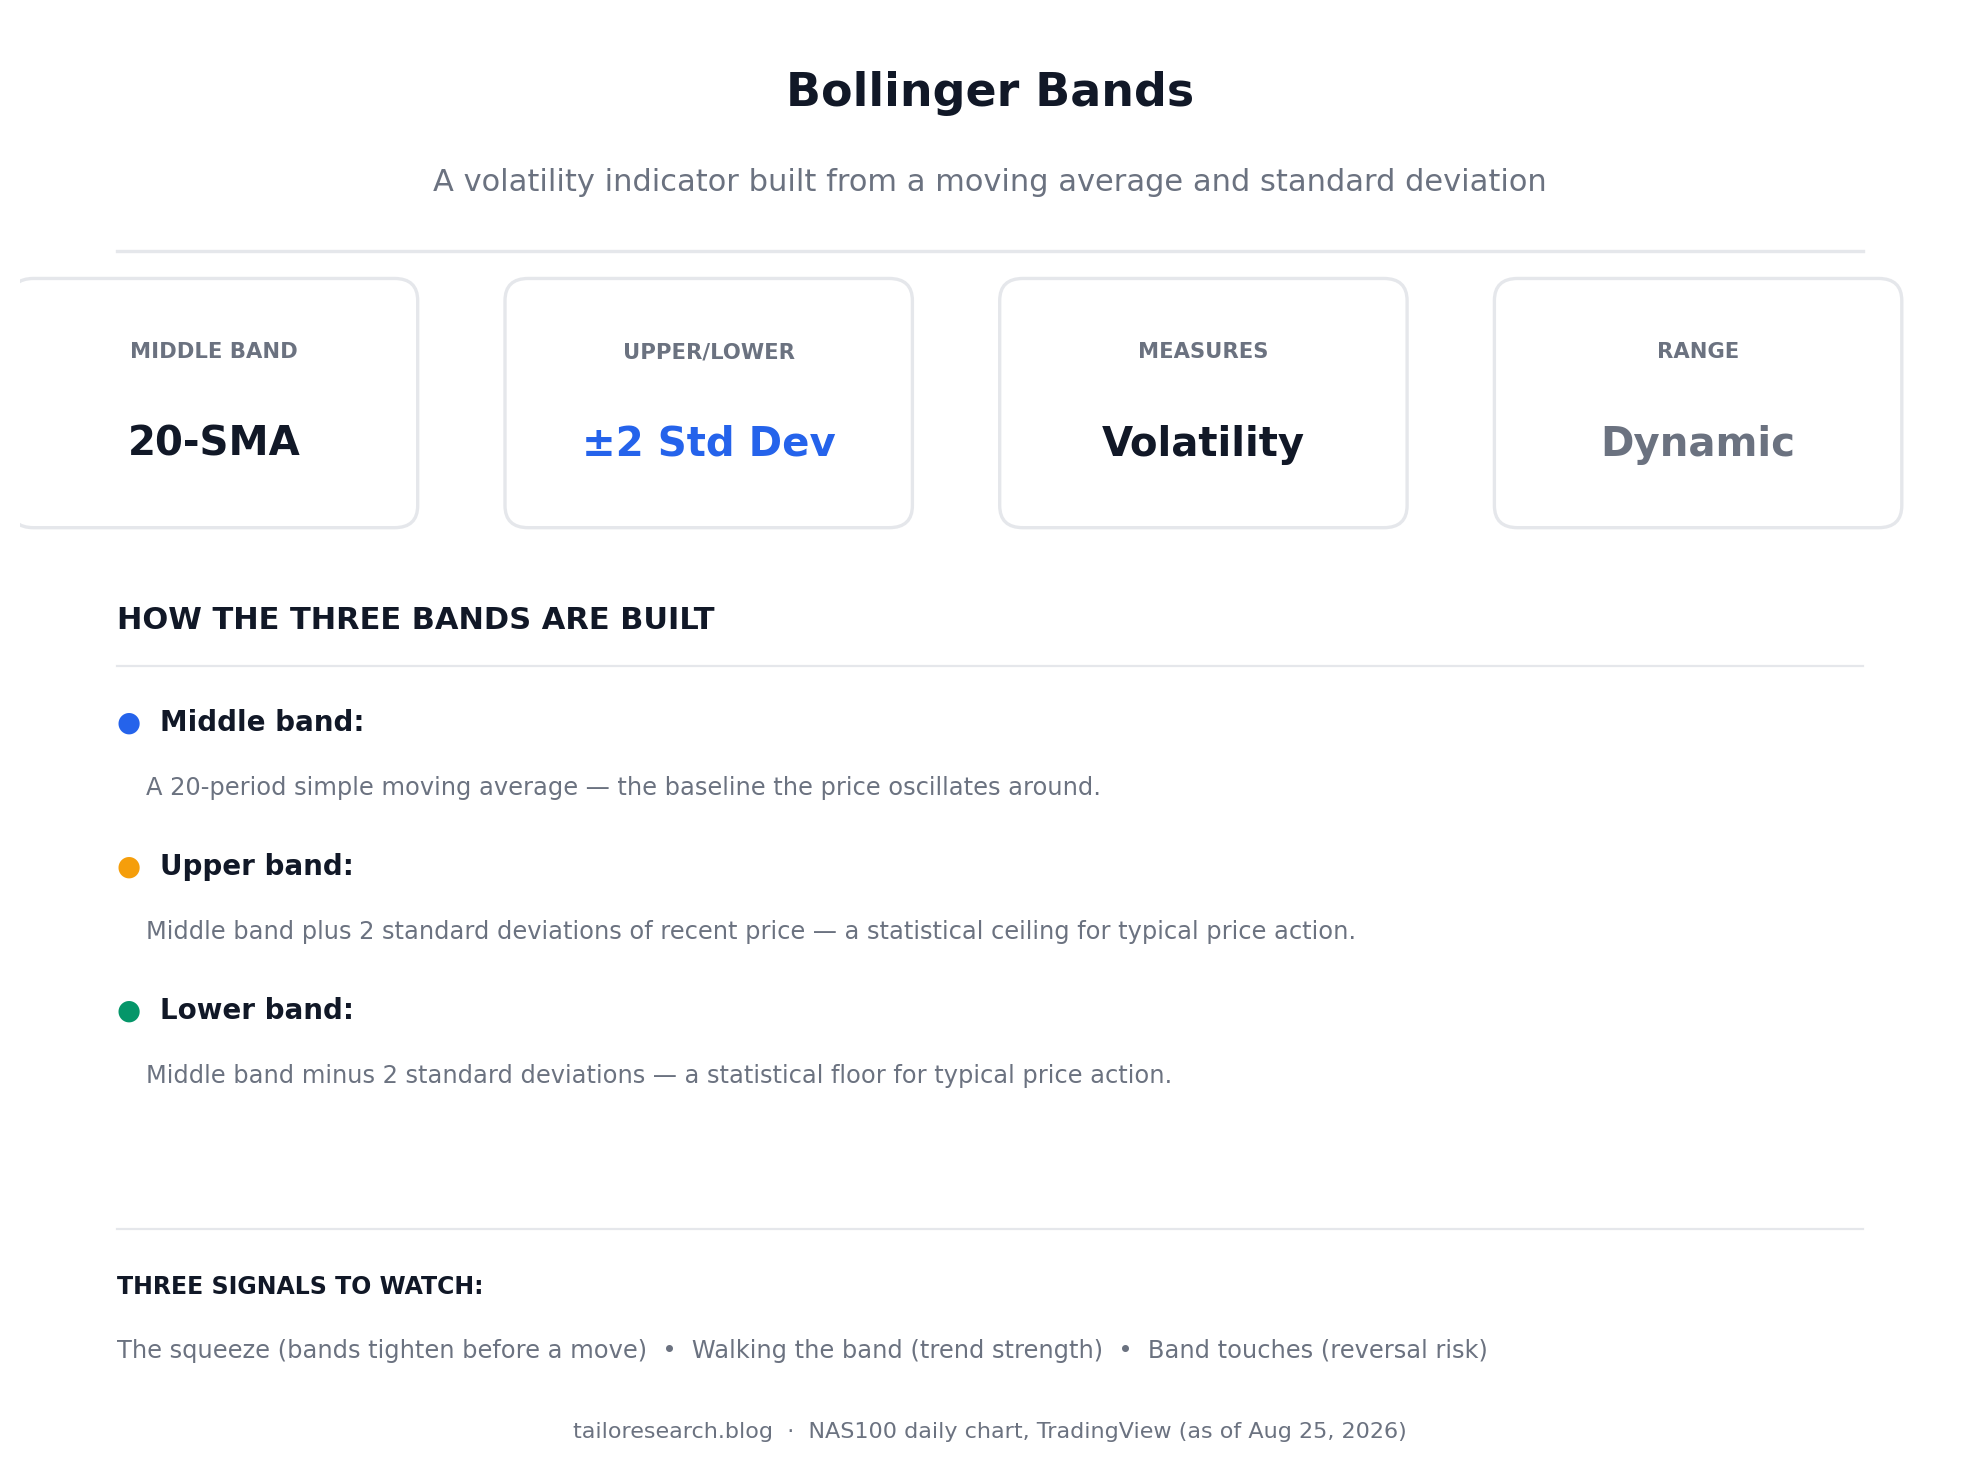
Bollinger Bands consist of three lines plotted directly on the price chart:
Middle band: A 20-period simple moving average. This is the baseline the price tends to oscillate around, and it functions similarly to any other moving average — a rough gauge of the prevailing short-to-medium-term trend.
Upper band: The middle band plus two standard deviations of recent price. Because standard deviation measures how spread out price action has been, this band moves further away from the middle band as volatility rises, and closer as volatility falls.
Lower band: The middle band minus two standard deviations. It mirrors the upper band on the downside, acting as a statistical floor for typical price action under current volatility conditions.
Because both outer bands are built from standard deviation rather than a fixed distance, they automatically widen during volatile periods and contract during quiet ones — this adaptive behavior is what separates Bollinger Bands from a simple price channel.
Three Signals to Watch
1. The squeeze. When the bands compress into a tight range, it signals unusually low volatility — and low volatility periods are frequently followed by sharp directional moves. Traders watch for a squeeze as an early warning that a breakout may be building, though the squeeze itself doesn’t tell you which direction the move will go.
2. Walking the band. During a strong trend, price can repeatedly touch or ride along the upper or lower band for an extended stretch rather than immediately reverting to the middle. This is called “walking the band,” and it’s a sign of trend strength — treating every band touch as an automatic reversal signal during a strong trend is a common beginner mistake.
3. Band touches and reversion. Outside of a strong trend, price touching or piercing an outer band can signal an overextended move that’s due to revert back toward the middle band. This is the classic mean-reversion read on Bollinger Bands, and it tends to work best in range-bound or choppy markets rather than trending ones.
The Biggest Mistake Traders Make With Bollinger Bands
The most common error is treating Bollinger Bands as a standalone buy-low-sell-high system — buying every lower-band touch and selling every upper-band touch, regardless of context. That approach works reasonably well in sideways, range-bound markets, but it can be badly wrong during a strong trend, where price can walk the band for weeks. The fix is context: check whether the broader trend is strong (walking the band, don’t fade it) or the market is range-bound (band touches are more likely to mean-revert).
Many traders pair Bollinger Bands with a momentum indicator like RSI or MACD to add that context — for example, only fading a lower-band touch when RSI is also showing oversold conditions, rather than acting on the band touch alone.
How Bollinger Bands Work With Other Indicators
Because the middle band is simply a 20-period simple moving average, Bollinger Bands share a direct link to the broader family of moving averages, and traders often read the two side by side. Price riding the upper band while the middle band also slopes higher confirms genuine trend strength, whereas a squeeze that eventually resolves against the slope of the middle band tends to be a lower-conviction signal — the trend context from the moving average helps filter out weaker breakout attempts.
Pairing Bollinger Bands with RSI or MACD adds a second, independent read on momentum rather than relying on price dispersion alone. A lower-band touch that coincides with RSI turning up out of oversold territory, or a MACD crossover in the same direction, gives more confidence in a mean-reversion trade than the band touch by itself. During a walking-the-band trend, watching MACD stay firmly on one side of the zero line also helps traders resist the urge to fade a strong move too early — the same discipline that separates a good Bollinger Band trader from someone just buying every dip.
A Quick Trade Example
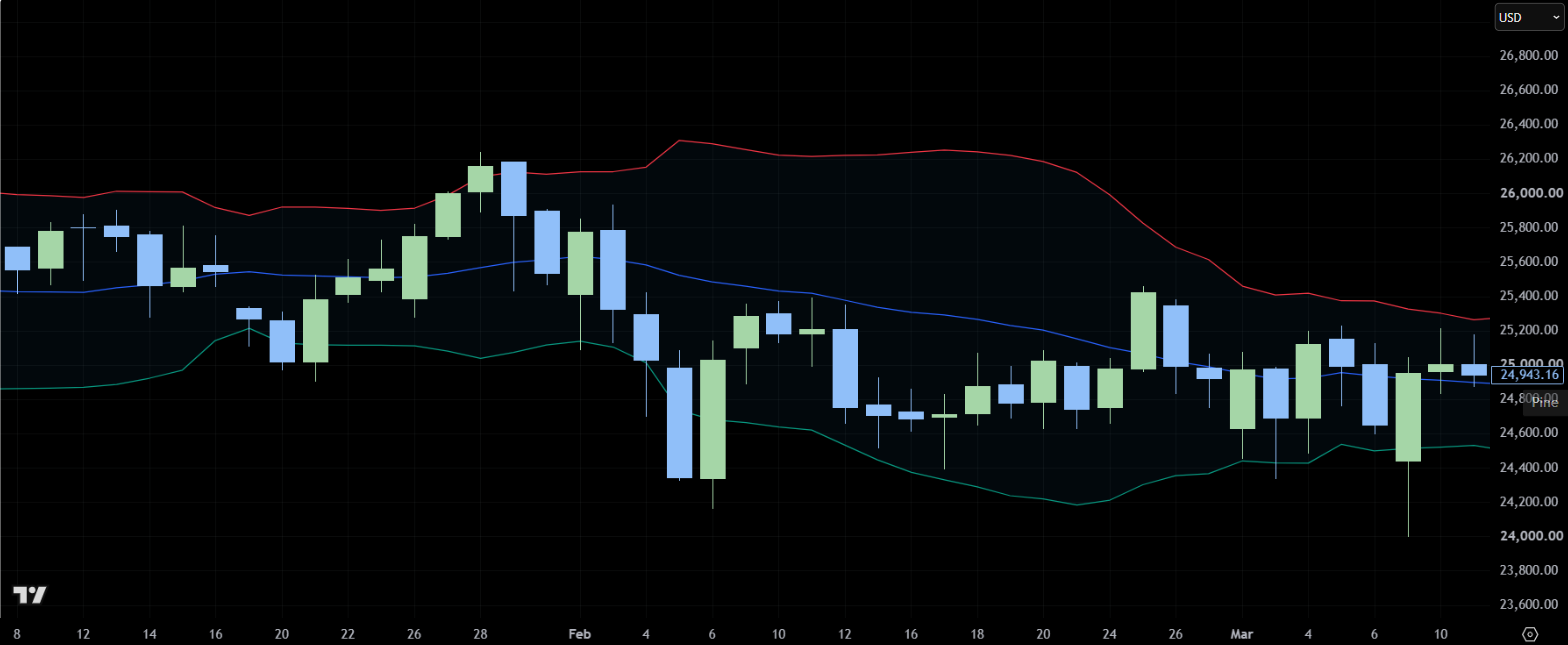
On the NAS100 daily chart shown above, the bands squeezed tightly through late January into early February — a visible warning that volatility was unusually compressed. Price then pierced the lower band in early February before snapping back sharply toward the middle band within days, a textbook mean-reversion setup rather than the start of a new downtrend. Traders who treated that single band pierce as a reversal signal without checking momentum could just as easily have been caught on the wrong side if the broader trend had been down instead of range-bound — which is exactly why context, not the band touch alone, is what makes the signal usable.
For related reading, see our guides to RSI, MACD, Moving Averages (SMA and EMA), and the Ichimoku Cloud, Support and Resistance, Fibonacci Retracement, Candlestick Patterns, Chart Patterns, and Risk Management.
Practicing Bollinger Band setups on a live chart with fast, reliable execution matters, especially around a squeeze breakout when volatility can spike quickly. Vantage Markets offers a wide range of CFD instruments with the charting tools needed to build and test Bollinger Band strategies in real market conditions.
Risk Disclaimer: CFDs are complex instruments and come with a high risk of losing money rapidly due to leverage. You should consider whether you understand how CFDs work and whether you can afford to take the high risk of losing your money. Past performance is not indicative of future results.
Affiliate Disclosure: This post contains an affiliate link. If you sign up through it, Tailo Research may earn a commission at no extra cost to you. We only recommend brokers and products we believe offer genuine value to our readers.

 Tailo-Research
Leave a comment