

Knowing where support and resistance sit is only half the job. The other half is deciding what to do when price arrives. This guide assumes you can already spot key levels; if not, start with our beginner-to-intermediate guide to support and resistance. Here we focus on how to trade them: three approaches, how to tell a real breakout from a false one, and how to turn a level into a plan with a defined stop and target.
Three ways to trade a level
| Approach | How it works | When it fits | Main risk |
|---|---|---|---|
| Bounce | Buy near support or sell near resistance, expecting the zone to hold | Range-bound markets and well-tested zones | The level breaks and price runs through your stop |
| Breakout | Enter when price closes beyond the zone | Strong momentum after a period of compression | False breakouts that reverse quickly |
| Retest | Wait for a broken level to be retested from the other side, then enter | Trending markets where old resistance becomes support | Missing the move if price never retests |
Breakouts vs false breakouts
Price sometimes pokes through a level, triggers stop orders and then reverses. This is a false breakout, and it is one of the most common ways traders lose money around levels. To reduce the odds of being caught:
- Wait for a candle to close beyond the zone rather than reacting to a wick.
- Look for a retest of the broken level that holds.
- Check whether volume expands on the breakout.
- Confirm on a higher timeframe so you are not trading noise.
- Be careful around scheduled events such as economic data releases, which often cause sudden spikes through levels.
Building the trade plan
- Idea: price is approaching a well-tested zone.
- Trigger: evidence at the zone, for example a bullish candlestick pattern that closes and holds.
- Stop: beyond the zone, where the idea is clearly wrong. Avoid placing it exactly at the obvious level, where stops cluster.
- Target: the next meaningful level in the direction of the trade.
- Reward-to-risk: compare the distance to your target with the distance to your stop. Skip trades where the reward is not clearly larger than the risk.
A worked example with numbers
Suppose an index trades around 25,000 and has a support zone between 24,900 and 24,950. A bullish candle closes above the zone at 24,960. You plan to enter there, put your stop at 24,880 (below the zone) and target the next resistance at 25,120.
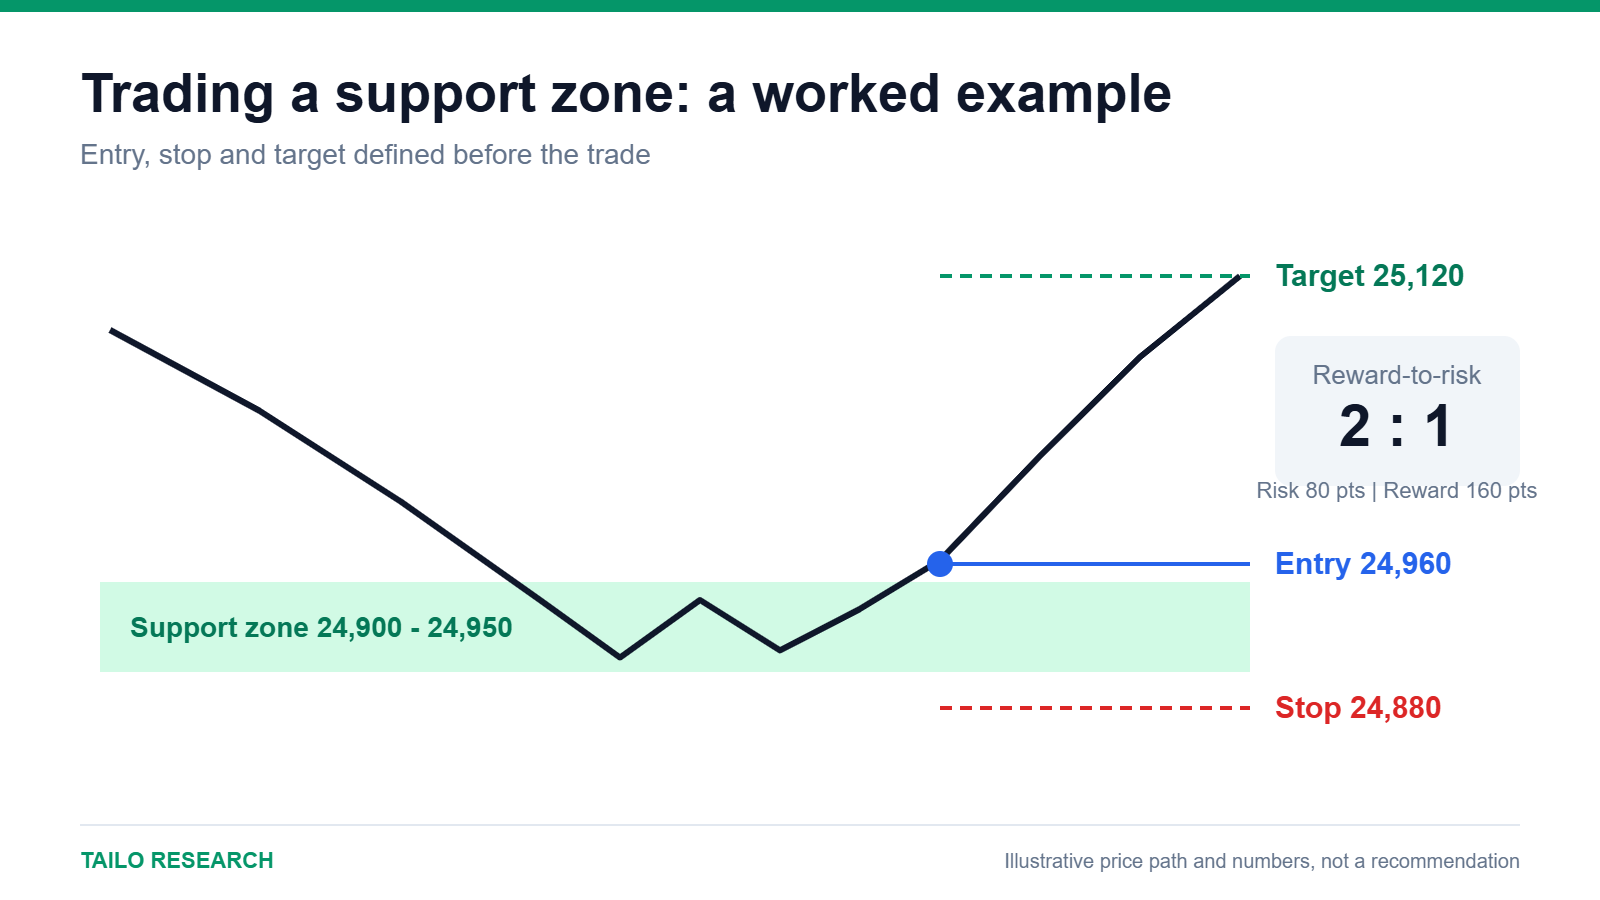
- Risk: 24,960 – 24,880 = 80 points
- Reward: 25,120 – 24,960 = 160 points
- Reward-to-risk: 2 to 1
Now check the size. On a contract worth $2 per point, such as MNQ, 80 points is $160 of risk per contract. If you only risk 1% of a $10,000 account, or $100, even one contract is too large. The honest answers are to skip the trade, find a tighter valid stop, or use a smaller instrument. The plan has to fit your account, not the other way around. (Illustrative numbers, not a recommendation.)
Common mistakes
- Treating levels as exact prices instead of zones
- Entering before any confirmation
- Placing stops exactly at the obvious level
- Ignoring the trend and trading every touch
- Holding on after a level has broken decisively
Key takeaways
- Decide in advance whether you are trading a bounce, a breakout or a retest.
- Wait for a close and a retest to avoid many false breakouts.
- Size the trade from your stop distance and your risk limit.
Ready to test level-based ideas on a demo account with TradingView charts? Open a Vantage account. This is an affiliate link: we may earn a commission at no extra charge from us. CFDs are complex instruments and carry a high risk of losing money rapidly due to leverage; most retail accounts lose money. See our Affiliate Disclosure and Risk Disclaimer.
Related reading
- Support and resistance levels: a beginner-to-intermediate guide
- How to read candlestick charts
- MNQ futures explained
Educational content only, not investment advice. Trading and investing involve risk, including the loss of your capital. Read our Risk Disclaimer and Affiliate Disclosure.


Leave a Reply