

Analyzing a stock does not need a finance degree, but it does need a process. Without one, it is easy to buy a story you like or chase a price that has already run. This framework gives you five repeatable steps that combine the business behind the stock with what the chart is telling you.
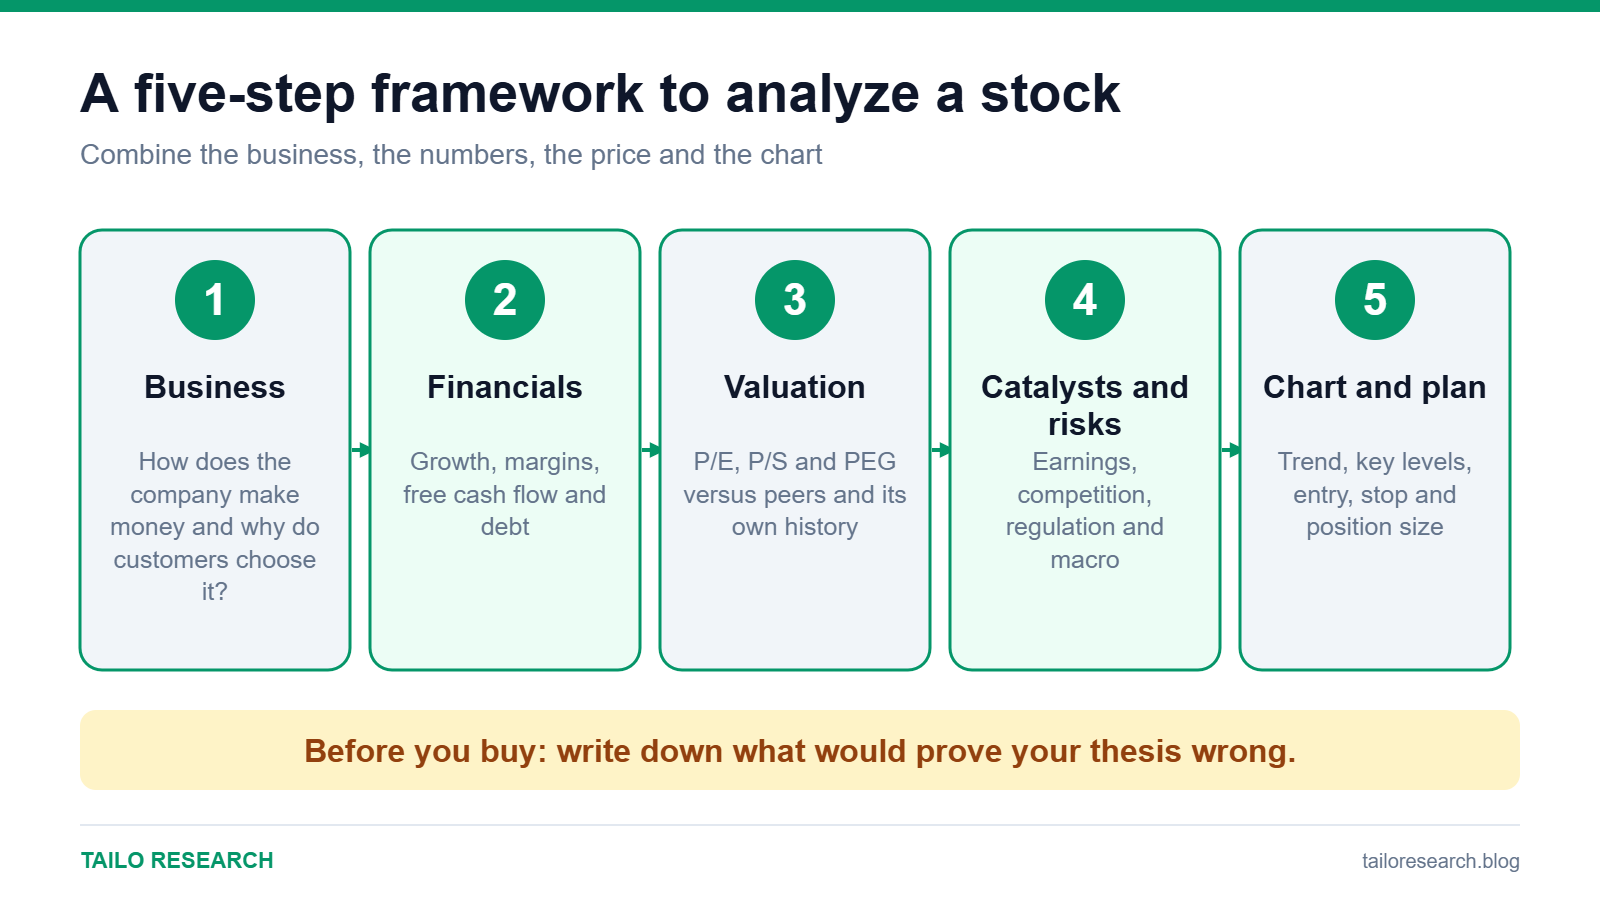
Step 1: Understand the business
Before looking at any number, be able to explain in two sentences how the company makes money and why customers choose it. Ask:
- What does the company sell, and to whom?
- How does it earn revenue: subscriptions, hardware, advertising, transaction fees?
- What protects it from competitors: brand, scale, technology, switching costs?
- Which parts of the business drive most of the profit?
Step 2: Check financial health
Company filings tell you whether the story is showing up in the numbers. In the US, annual (10-K) and quarterly (10-Q) reports are free on the SEC’s EDGAR database, and companies publish earnings releases on their investor relations pages.
| Metric | What it tells you | Watch out for |
|---|---|---|
| Revenue growth | Whether demand is expanding | Growth driven by one-off deals or acquisitions |
| Gross and operating margin | How profitable each sale is | Shrinking margins as competition rises |
| Free cash flow | Cash left after running and investing in the business | Profits that never turn into cash |
| Debt and interest coverage | Balance sheet strength | Heavy debt due soon in a high-rate environment |
| Share count | Whether owners are being diluted | Steady increases from stock-based pay or new issuance |
Step 3: Judge valuation
A great company can still be a poor investment at the wrong price. Common yardsticks include:
- Price-to-earnings (P/E): the share price relative to earnings per share. Compare forward P/E (based on expected earnings) with the company’s own history and with peers.
- Price-to-sales (P/S): useful for fast-growing companies with thin profits.
- PEG ratio: P/E adjusted for expected growth.
No single ratio is decisive. A high multiple can be justified by strong growth and a low one can signal a business in trouble. Always compare like with like.
Step 4: Weigh catalysts and risks
- Catalysts: upcoming earnings, product launches, new markets, buybacks, index inclusion.
- Risks: competition, regulation, customer concentration, supply chains, rising costs.
- Macro sensitivity: how the stock reacts to rates, inflation and growth. See how economic data moves markets.
Write down what would make you wrong. If you cannot name a scenario that would change your mind, you do not yet have a thesis, only a hope.
Step 5: Read the chart and plan the trade
Fundamentals tell you what to consider owning. The chart helps you decide when and where. Check:
- Trend: is price making higher highs and higher lows, or the opposite?
- Key levels: where has price reacted before? See support and resistance.
- Candles at those levels: candlestick patterns can show whether buyers or sellers are taking over.
- Volume: is participation rising on the moves that matter?
- Relative strength: is the stock outperforming its sector or the index?
Then plan the trade: entry zone, stop-loss where your idea is wrong, and a target that offers meaningful reward for the risk.
Position sizing and risk
Decide in advance how much of your account you are willing to lose if the trade fails, and size the position so that the distance to your stop equals that amount. Many traders keep single-trade risk to a small fraction of the account. Spreading money across several ideas and using diversified funds such as ETFs can reduce the damage from being wrong on one company.
A quick checklist
- I can explain how the company makes money in two sentences.
- Revenue, margins and cash flow are heading in the right direction, or I know why not.
- The valuation makes sense against growth and peers.
- I know the main catalysts and the main risks.
- The chart shows a level to enter, a level where I am wrong and a realistic target.
- My position size limits the loss if I am wrong.
Key takeaways
- Combine the business, the numbers, the price and the chart.
- Define what would prove you wrong before you buy.
- Size positions from risk, not from conviction.
Related reading
Educational content only, not investment advice. Trading and investing involve risk, including the loss of your capital. Read our Risk Disclaimer and Affiliate Disclosure.


Leave a Reply