RSI is usually the first technical indicator new traders ever learn — and, ironically, the one they end up using backwards more often than any other. It shows up on nearly every default charting layout, gets mentioned in almost every “learn to trade” video, and yet most beginners walk away with a rule that actively hurts them: sell when it hits 70, buy when it hits 30.
That rule isn’t wrong so much as incomplete. Used properly, RSI tells you a lot about the strength and sustainability of a move. Used as a mechanical on/off switch, it will get you selling into the strongest part of an uptrend and buying into the middle of a crash. This guide walks through what RSI actually measures, why the 70/30 levels are more nuanced than they look, and how to combine RSI with divergence, trend, and volume so it becomes a genuinely useful tool rather than a trap.
What Is RSI, Exactly?
The Relative Strength Index (RSI) was developed by J. Welles Wilder Jr. and introduced in his 1978 book New Concepts in Technical Trading Systems — the same book that gave traders the Average True Range (ATR) and the Parabolic SAR. RSI measures the speed and magnitude of recent price changes and converts that into a single number between 0 and 100, so you can gauge at a glance whether buying pressure or selling pressure has been dominant.
The calculation itself is simple in concept: RSI compares the average size of recent up-moves to the average size of recent down-moves.
RSI = 100 − [100 / (1 + RS)], where RS = Average Gain ÷ Average Loss over the lookback period.
Wilder’s original method smooths this average over time rather than using a simple moving average — the first value is a plain average of gains and losses over the period, and every value after that is calculated as [(previous average × (period − 1)) + current value] ÷ period. This smoothing is why RSI reacts quickly to sharp moves but doesn’t whipsaw on every small tick.
You’ll never need to calculate this by hand — every charting platform does it automatically — but understanding the mechanics helps explain RSI’s behavior. The default lookback period is 14 candles (Wilder’s original recommendation), though it’s adjustable. A shorter period (say, 7 or 9) makes RSI more sensitive and reacts faster to new moves, at the cost of more false signals. A longer period (21 or higher) smooths out the noise but reacts more slowly to genuine shifts in momentum. Fourteen remains the standard for a reason — it’s a reasonable middle ground that works across most timeframes and instruments.

The 70/30 Rule Isn’t What Most Beginners Think
The textbook interpretation is straightforward: RSI above 70 signals an overbought condition, and RSI below 30 signals oversold. On the surface, that sounds like a ready-made buy/sell system — sell when it’s “too high,” buy when it’s “too low.”
The problem is that 70 and 30 are not reversal triggers. They’re closer to a temperature gauge that tells you how hot or cold current momentum is, not a signal that momentum is about to flip. For a beginner, the more actionable reference point is often the 50 line, not the 70/30 extremes:
- RSI above 50 generally means upside momentum has the edge over the recent lookback period.
- RSI below 50 generally means downside momentum has the edge.
Watching which side of 50 the RSI line is on — and which direction it’s heading — gives a cleaner read on the balance of power than waiting for it to touch an extreme.
There’s also a well-documented pattern worth knowing: RSI tends to trade in different ranges depending on the broader trend. In a strong uptrend, RSI often oscillates between roughly 40 and 90, with the 40–50 zone acting as support on pullbacks rather than a sell signal. In a strong downtrend, RSI tends to oscillate between roughly 10 and 60 (some technicians use 20–65), with the 50–60 zone acting as resistance on bounces rather than a buy signal. In other words, “overbought” and “oversold” mean something different depending on which regime the market is in — a healthy uptrend can run with RSI pinned above 70 for weeks.
The Classic Beginner Mistake: Selling at 70, Buying at 30
This is the single most common way new traders misuse RSI, and it’s worth spelling out exactly why it fails.
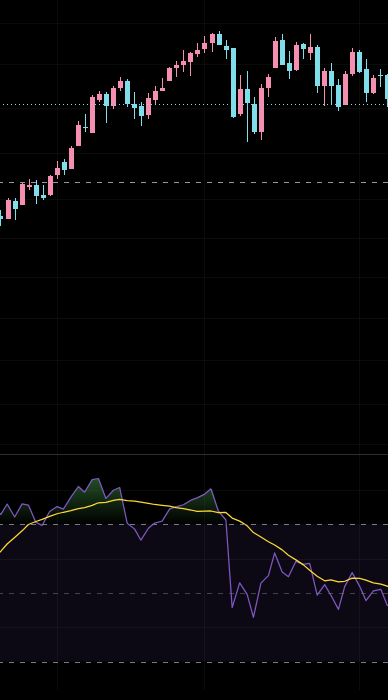
In a genuinely strong uptrend, RSI can push above 70 and simply stay there — grinding in the 80s or even touching 90 — while price continues to climb for an extended stretch. A trader who exits the moment RSI crosses 70 isn’t catching a top; they’re stepping off the train right as it accelerates. The chart below shows a real example: NAS100 rallying through April–June 2026, with RSI pushing into the 70–90 zone and holding there for weeks while price kept making new highs.
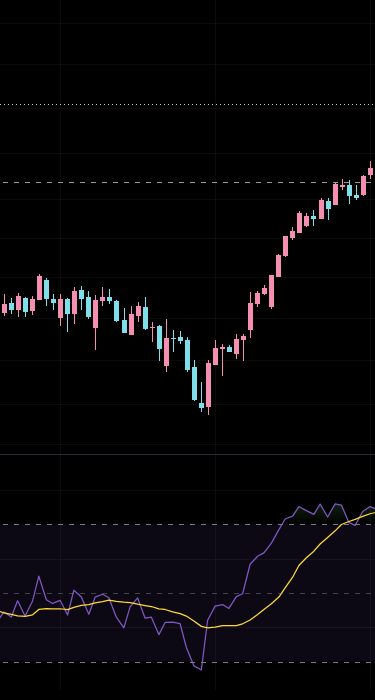
The mirror image happens in downtrends. During the sharp NAS100 decline in February–March 2026, RSI dropped into the low 20s and stayed depressed through the worst of the sell-off. A trader buying purely because “RSI hit 30, it must be oversold” would have bought into a market that continued to fall before eventually stabilizing.
This is sometimes called the overbought paradox: an elevated RSI during a strong uptrend is usually a sign of strength, not exhaustion. It reflects real, sustained buying pressure — not necessarily an imminent reversal. RSI is also, by design, a lagging indicator; it’s calculated from price that has already happened, so it describes recent momentum rather than predicting the next candle. In a powerful trend, “overbought” and “oversold” readings can persist far longer than most beginners expect, which is exactly why trend context matters more than the raw number.
Divergence: Where RSI Actually Earns Its Keep
If the 70/30 crossover isn’t the real signal, what is? For most intermediate traders, RSI’s genuine value shows up in divergence — situations where price and RSI disagree about direction.
Bullish divergence: price makes a lower low, but RSI makes a higher low. This suggests that even though price pushed to a new low, the selling momentum behind that move was actually weaker than the move before it — a potential early sign that downside pressure is fading.
Bearish divergence: price makes a higher high, but RSI makes a lower high. This suggests upside momentum is weakening even as price grinds to a new high — a caution flag that the rally may be running out of fuel.
There’s also a related, more subtle signal worth watching: trend reversals often begin not with a dramatic divergence, but simply when RSI stops reaching its prior extremes. If a stock has been making a series of RSI peaks near 85, and the next peak only reaches 65, that’s often an earlier tell than waiting for a textbook divergence pattern to fully form.
The chart below shows a case that looks like classic bearish divergence on NAS100: price pushes to a high that’s roughly in line with (or slightly above) the prior peak, while RSI makes a noticeably lower high — shortly before a sharp pullback.
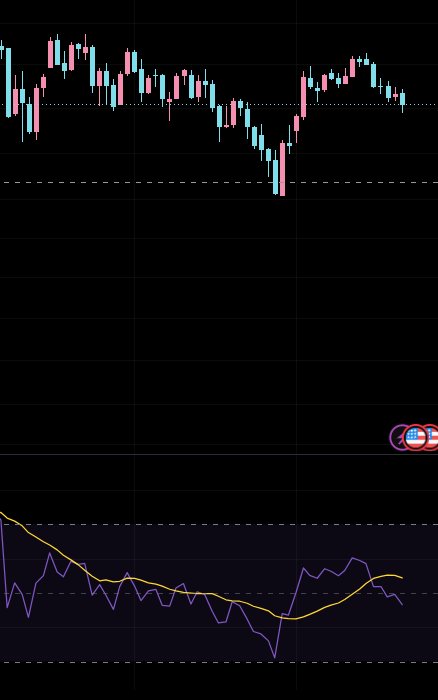
One important caveat: divergence is a warning sign, not a countdown timer. It can persist for a while before price actually turns, and in a genuinely strong trend it can simply resolve itself without a reversal at all. That’s why divergence works best as a heads-up to pay closer attention — combined with confirmation from other signals — rather than as a standalone entry trigger.
RSI Is a Supporting Indicator, Not a “Trade Button”
It’s worth repeating plainly: RSI crossing 70 or 30 is not, by itself, a buy or sell signal. RSI shows you which direction recent momentum has been leaning — it doesn’t predict the exact moment price will turn. Treating it as a standalone mechanical system is where most of the beginner mistakes above originate.
In practice, RSI works best as one input among several:
- Trend context — is the broader structure trending or ranging? An overbought reading in a strong trend means something very different from an overbought reading in a sideways market.
- Volume — does a divergence or extreme reading come with rising or falling volume? Weakening volume on a new high can reinforce a bearish divergence signal; strong volume can undercut it.
- Price structure — trendline breaks, support/resistance levels, and prior swing highs/lows all give RSI signals more (or less) credibility.
None of these need to be complicated. The point isn’t to build a five-indicator system — it’s to avoid making a decision off RSI alone when a quick glance at the trend or volume would tell a different story.
Key Takeaways for Beginners
RSI is a momentum oscillator, not a crystal ball. It’s calculated from past price action, so it’s inherently a lagging tool — and in a strong trend, overbought and oversold conditions can persist for far longer than the textbook 70/30 levels suggest. Rather than memorizing “sell at 70, buy at 30,” a more realistic approach for a beginner is to build the habit in this order:
- Check which side of the 50 line RSI is on, and which direction it’s heading.
- Look for divergence between price and RSI at potential turning points.
- Confirm with volume and overall trend structure before treating either signal as actionable.
RSI won’t tell you exactly when a move will end. What it will do, when read correctly, is give you a clearer sense of how much strength is actually behind the current move — which is often more useful than a false sense of precision.
For related reading, see our guides to Moving Averages (SMA and EMA) and the Ichimoku Cloud.
If you want to put these RSI concepts into practice, Vantage Markets gives you access to NAS100 and other major markets with competitive spreads and fast execution. Open a free Vantage Markets account and start applying what you’ve learned.
This content is for informational and educational purposes only and does not constitute financial advice. Trading CFDs carries a high level of risk and may not be suitable for all investors. Past performance is not indicative of future results. Please read our full Risk Disclaimer and Affiliate Disclosure before making any trading decisions.
 Tailo-Research
Leave a comment