

QQQ and VOO are two of the largest and most widely held ETFs in the world, and they often sit side by side in the same portfolio. Both give you exposure to big US companies, but they are built differently. QQQ tracks the Nasdaq-100 and leans heavily toward technology. VOO tracks the S&P 500 and spreads across every major sector.
This comparison lays out what each fund holds, what it costs, how much it can swing and how to think about which one fits your goal. Figures below are approximate as of 2026 and change over time, so always check the fund providers’ own pages before investing.
QQQ vs VOO at a glance
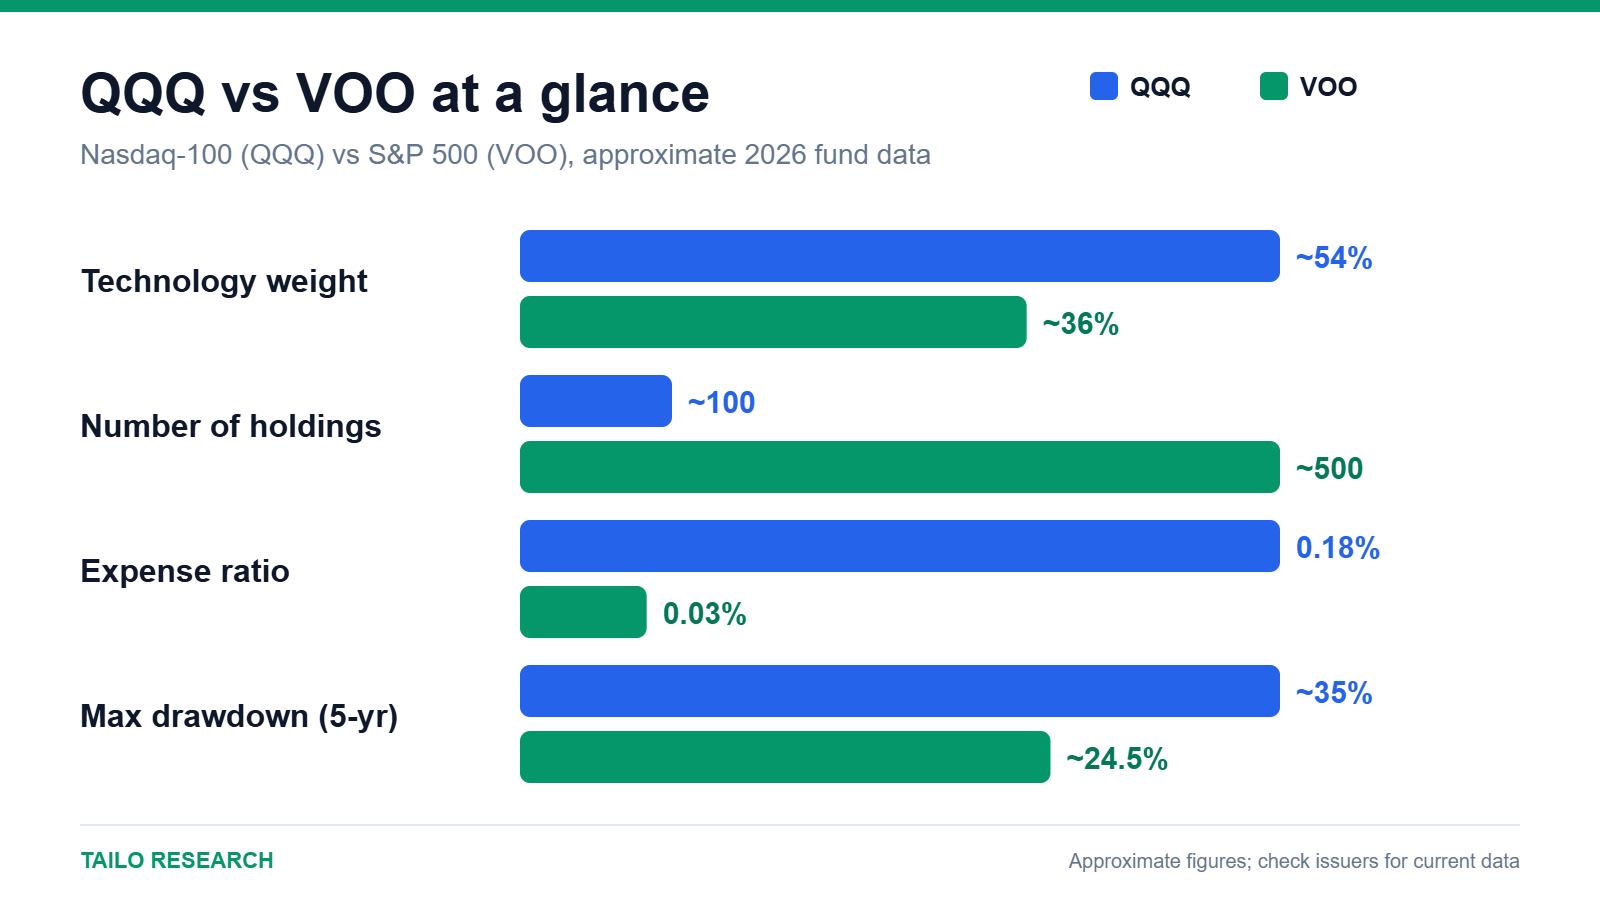
| QQQ (Invesco) | VOO (Vanguard) | |
|---|---|---|
| Index tracked | Nasdaq-100 | S&P 500 |
| Number of holdings | About 100 | About 500 |
| Technology weight | Roughly half or more of the fund | Roughly a third |
| Financials weight | Very small (the index excludes most financial companies) | About 11% to 13% |
| Expense ratio | About 0.18% | About 0.03% |
| Dividend yield | Roughly 0.4% | Roughly 1% |
| Volatility | Higher | Lower |
What each fund holds
The Nasdaq-100 contains the 100 largest non-financial companies listed on the Nasdaq exchange. That makes it dominated by technology, communication services and consumer discretionary names, with very little in financials, energy or utilities. The S&P 500 covers roughly 500 large US companies across all sectors, including banks, healthcare, industrials and energy.
The two overlap a lot. The biggest positions in both are usually the same mega-cap technology companies, and by weight roughly half of the two portfolios is shared. If you own both, you are not diversifying as much as the number of funds suggests.
Cost
VOO is much cheaper. On a $10,000 investment, a 0.03% expense ratio costs about $3 per year, while a 0.18% ratio costs about $18. The gap is small in dollars for most people but compounds over decades. Invesco also offers a lower-cost share class, QQQM, that tracks the same index, so check whether that suits your situation.
Risk and volatility
Concentration cuts both ways. Over the past decade QQQ has generally delivered higher total returns than VOO, but with deeper drawdowns. Public fund data shows a maximum drawdown of roughly 35% for QQQ against about 24.5% for VOO over a recent five-year window, and QQQ’s beta (a measure of sensitivity to the market) sits above 1. In the 2022 sell-off the Nasdaq-100 fell roughly a third while the S&P 500 fell nearer a fifth. Past returns do not guarantee future returns, and leadership among sectors changes.
Which one fits which goal?
- Broad, low-cost core holding: VOO fits this role more naturally because it is diversified and cheap.
- Growth tilt with higher risk tolerance: QQQ concentrates in growth and technology leaders and accepts larger swings.
- Income focus: neither is an income fund, but VOO yields more.
- Short time horizon: higher volatility can hurt if you may need the money within a few years.
Many investors hold a broad fund like VOO as the base and add a smaller position in QQQ if they want extra technology exposure. That is a description of a common approach, not a recommendation.
If you invest from outside the United States
US-listed ETFs may not be available or tax-efficient for residents of some countries, including the EU and UK. Similar funds tracking the same indices exist in other domiciles, so check what your broker and local rules allow.
Trading the same index other ways
You do not have to hold an ETF to trade the Nasdaq-100. Traders also use futures and CFDs. See our guide to Micro E-mini Nasdaq-100 (MNQ) futures and our explainer on how ETFs work for the basics.
Key takeaways
- QQQ is a concentrated, tech-heavy growth fund; VOO is a broad, low-cost core fund.
- They overlap heavily, so owning both is not full diversification.
- Higher potential return in QQQ has come with deeper drawdowns.
Related reading
Educational content only, not investment advice. Trading and investing involve risk, including the loss of your capital. Read our Risk Disclaimer and Affiliate Disclosure.


Leave a Reply