

Price tells you what happened; volume tells you how much conviction was behind it. This guide covers how to read volume alongside price action.
What volume measures
Volume is simply the number of shares or contracts traded in a given period. A price move on unusually high volume suggests broad participation and stronger conviction; the same move on thin volume can be less reliable and more prone to reversing.
Common volume patterns
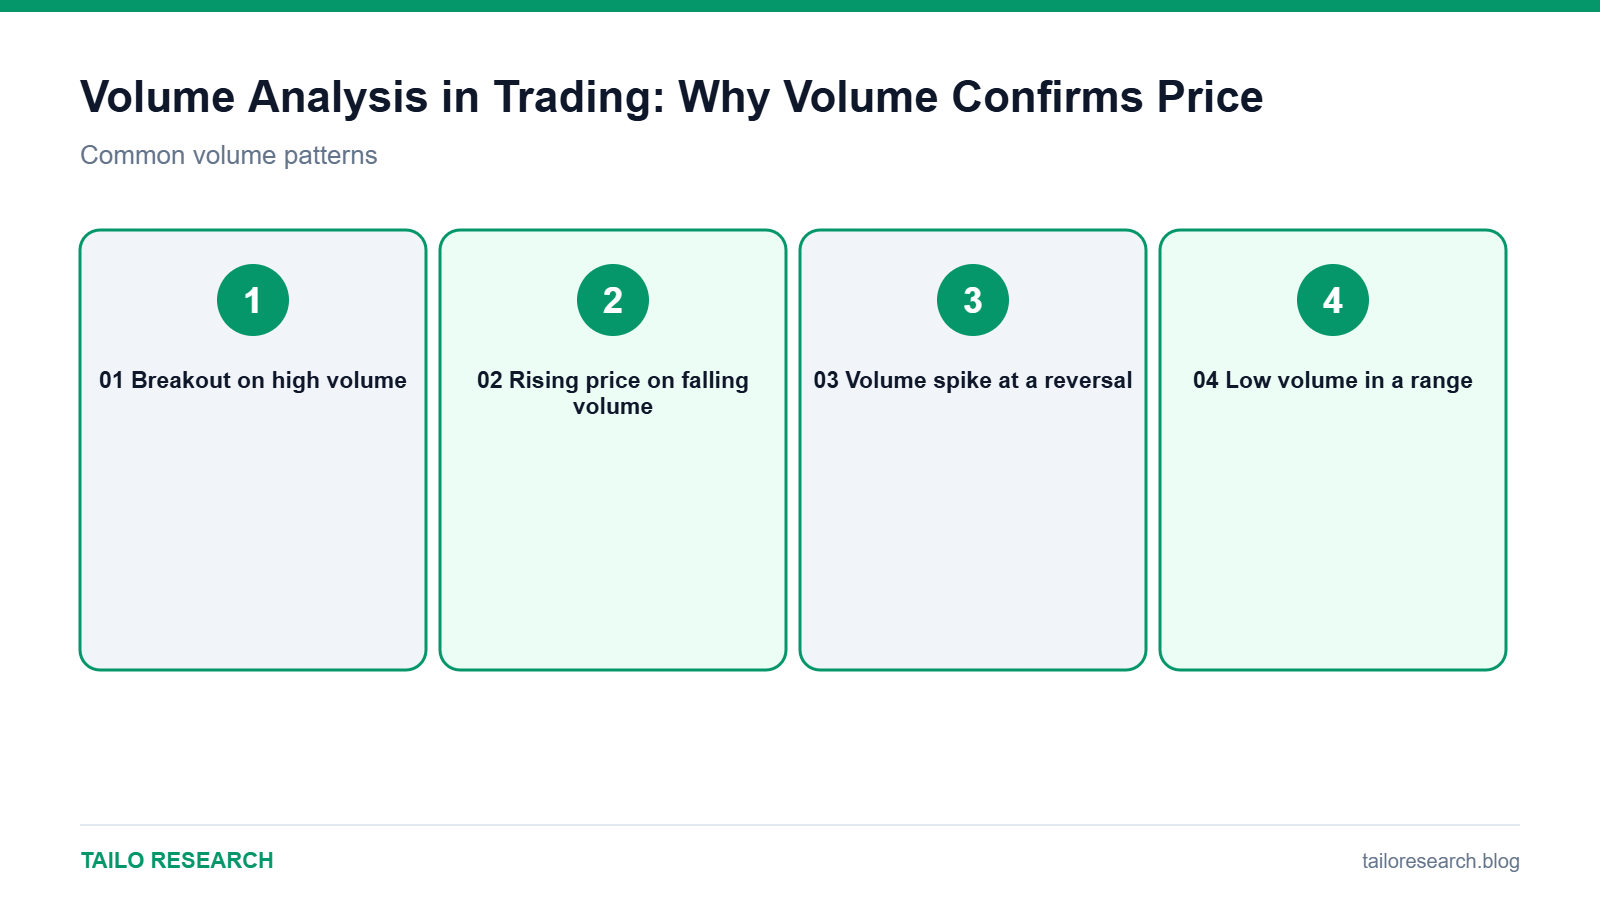
- Breakout on high volume: generally considered more likely to hold than a breakout on low volume
- Rising price on falling volume: can signal weakening momentum, even while price still climbs
- Volume spike at a reversal: often marks capitulation or exhaustion at the end of a strong move
- Low volume in a range: consistent with indecision rather than a real breakout or breakdown
Using volume with support and resistance
A test of a support or resistance level accompanied by high volume tends to carry more significance than the same test on quiet, low-volume trading. See our guide to support and resistance for how to combine the two.
Key takeaways
- Volume measures how much participation is behind a price move.
- High-volume moves generally carry more conviction than low-volume moves.
- Combining volume with key price levels adds useful confirmation to a trade idea.
Want to trade what you read here as a CFD alongside TradingView charts? Open a Vantage account. This is an affiliate link: we may earn a commission at no extra charge from us. CFDs are complex instruments and carry a high risk of losing money rapidly due to leverage; most retail accounts lose money.
Educational content only, not investment advice. Trading and investing involve risk, including the loss of your capital. Read our Risk Disclaimer and Affiliate Disclosure.


Leave a Reply