


Trend lines are one of the simplest technical tools, connecting a series of highs or lows to visualize the direction and pace of a trend. This guide covers how to draw them properly.
How to draw a valid trend line
- In an uptrend, connect at least two, ideally three or more, rising swing lows
- In a downtrend, connect at least two, ideally three or more, falling swing highs
- Use the actual price extremes (wicks), not just candle bodies, for the most objective line
- Extend the line forward to see where it currently sits
What a trend line represents
A trend line approximates the pace of a trend and can act as dynamic support (in an uptrend) or resistance (in a downtrend), similar to a horizontal support or resistance level, but sloped.
Common mistakes
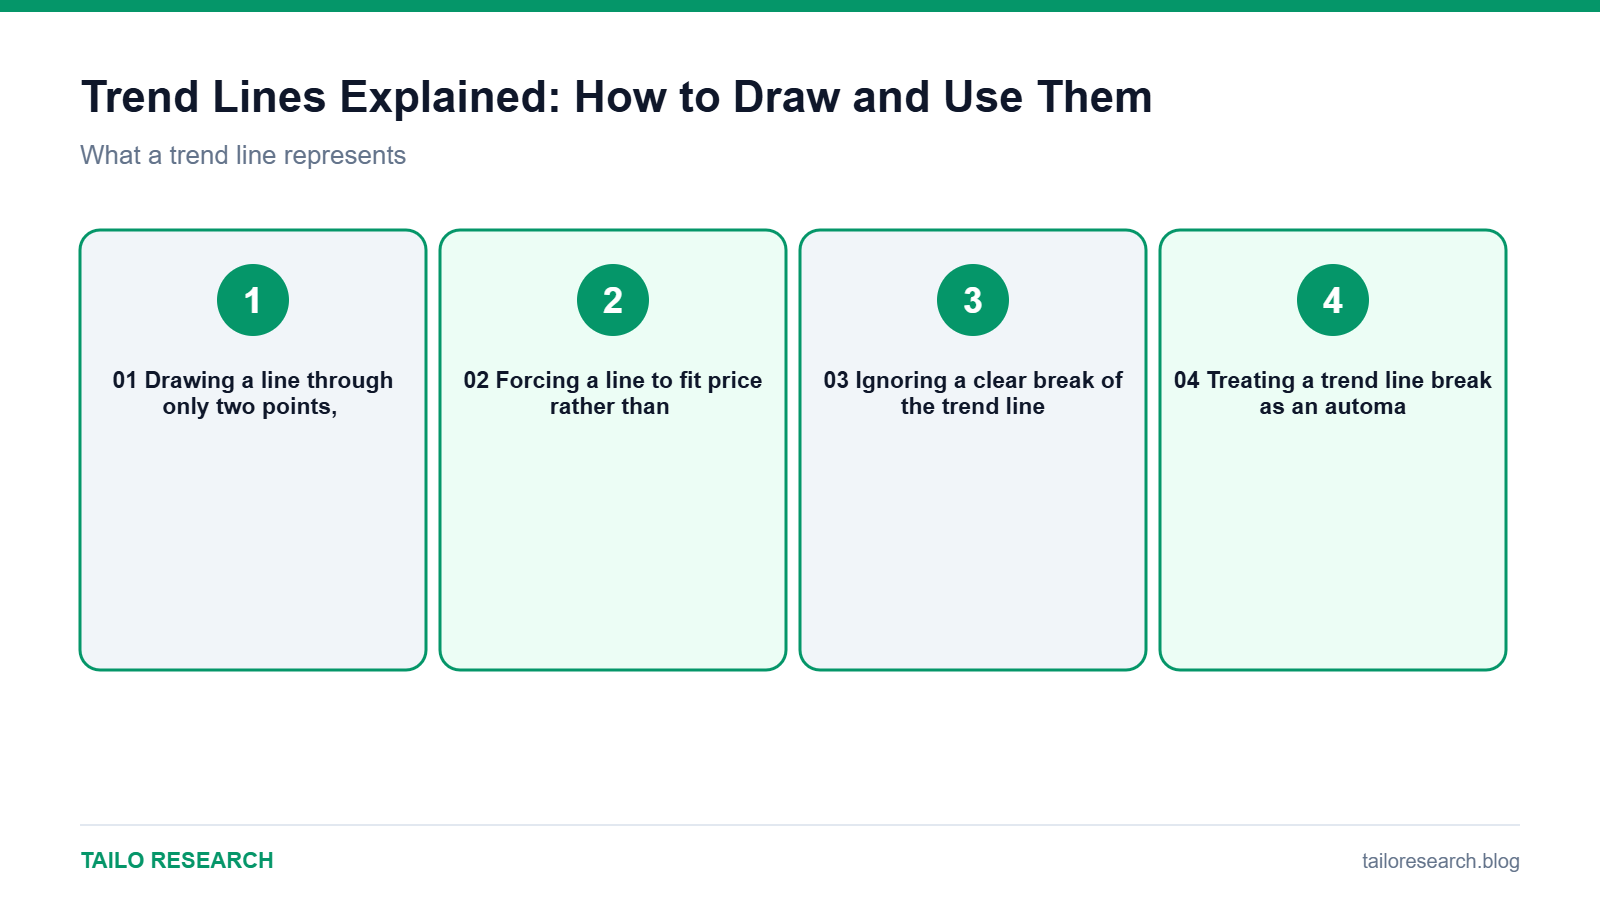
- Drawing a line through only two points, which is not enough to confirm a genuine trend
- Forcing a line to fit price rather than letting the touches define it objectively
- Ignoring a clear break of the trend line because of attachment to the original idea
- Treating a trend line break as an automatic reversal signal without other confirmation
Key takeaways
- A valid trend line needs at least two, ideally three or more, touches to be meaningful.
- Trend lines act as dynamic, sloped support or resistance.
- A break of a trend line is a signal worth noting, not an automatic reversal confirmation on its own.
Want to trade what you read here as a CFD alongside TradingView charts? Open a Vantage account. This is an affiliate link: we may earn a commission at no extra charge from us. CFDs are complex instruments and carry a high risk of losing money rapidly due to leverage; most retail accounts lose money.
Educational content only, not investment advice. Trading and investing involve risk, including the loss of your capital. Read our Risk Disclaimer and Affiliate Disclosure.


Leave a Reply