

The stochastic oscillator compares a security’s closing price to its price range over a set period, aiming to identify overbought and oversold conditions. This guide covers the basics and its limitations.
How it works
The stochastic oscillator produces a value between 0 and 100 based on where the current close sits relative to the recent high-low range. Readings above 80 are typically read as overbought; readings below 20 as oversold. It plots two lines, %K (the raw value) and %D (a smoothed moving average of %K).
The signal traders watch
Many traders watch for %K crossing above or below %D as a potential turning-point signal, particularly when it happens in the overbought or oversold zones rather than in the middle of the range.
The key limitation: trending markets
In a strong, sustained trend, the stochastic oscillator can stay in overbought or oversold territory for extended periods without the price reversing, producing repeated false signals for traders expecting an immediate turn. It tends to work better in range-bound markets than strongly trending ones.
How to use it more reliably
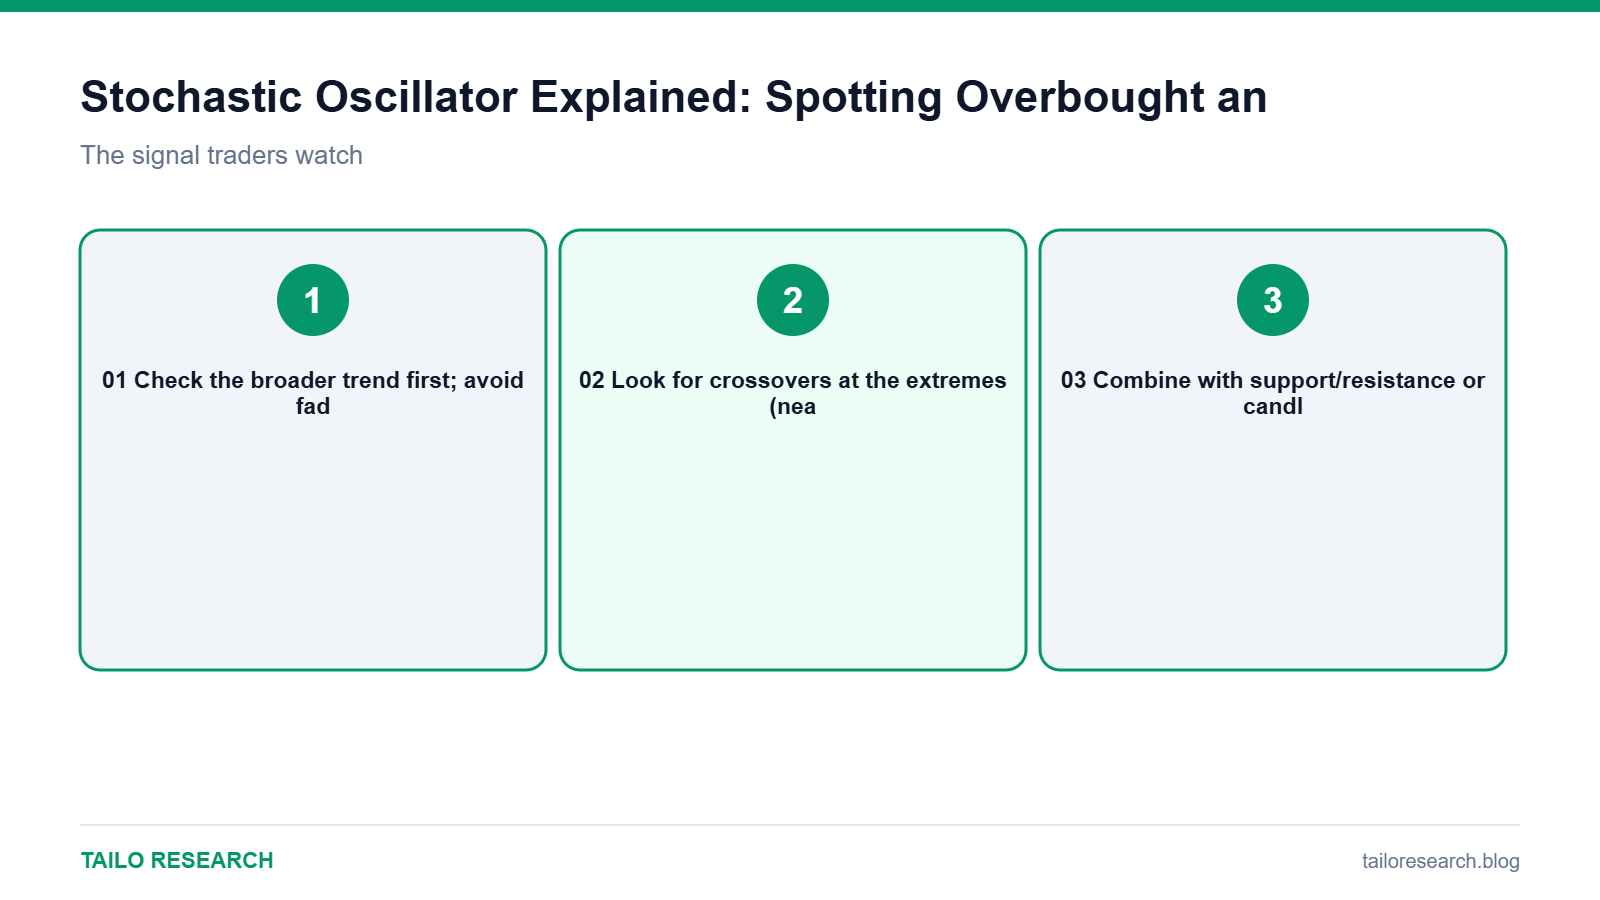
- Check the broader trend first; avoid fading a strong trend based on stochastic readings alone
- Look for crossovers at the extremes (near 80 or 20), not in the middle of the range
- Combine with support/resistance or candlestick confirmation rather than trading the signal in isolation
Key takeaways
- The stochastic oscillator identifies overbought (above 80) and oversold (below 20) conditions.
- It can stay extreme for long stretches during strong trends, producing false signals.
- It works best combined with trend context and other confirmation, not on its own.
Want to trade what you read here as a CFD alongside TradingView charts? Open a Vantage account. This is an affiliate link: we may earn a commission at no extra charge from us. CFDs are complex instruments and carry a high risk of losing money rapidly due to leverage; most retail accounts lose money.
Educational content only, not investment advice. Trading and investing involve risk, including the loss of your capital. Read our Risk Disclaimer and Affiliate Disclosure.


Leave a Reply