


Moving average crossovers are among the most widely referenced technical signals in financial media. This guide explains what they actually measure and why they lag price by nature.
The two famous crossovers
| Signal | What happens | Common reading |
|---|---|---|
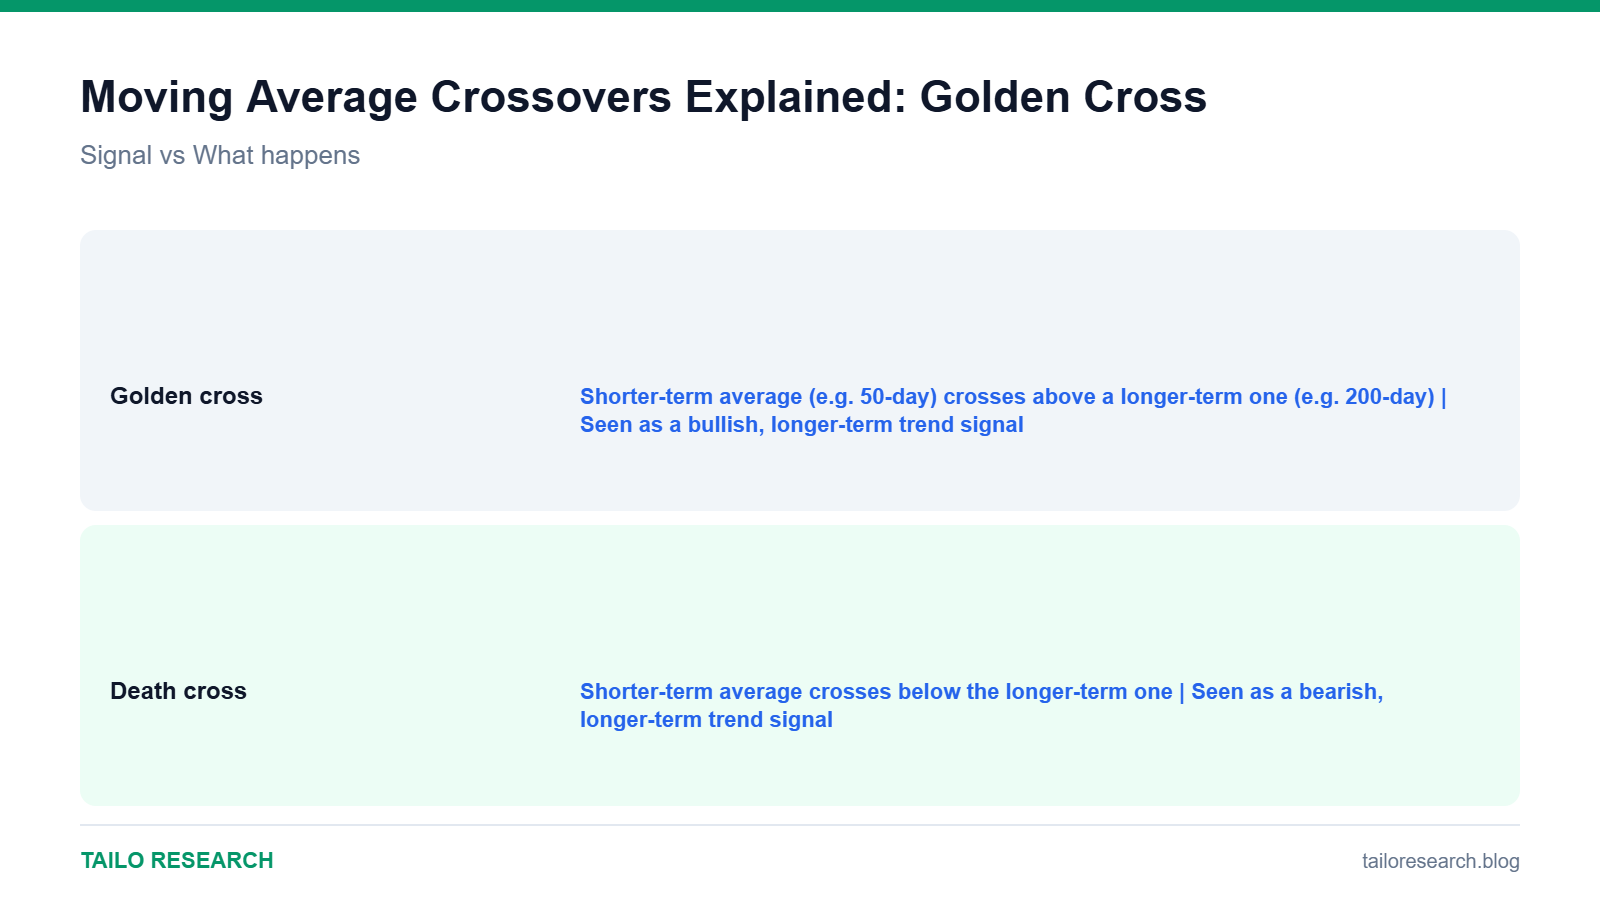
| Golden cross | Shorter-term average (e.g. 50-day) crosses above a longer-term one (e.g. 200-day) | Seen as a bullish, longer-term trend signal |
| Death cross | Shorter-term average crosses below the longer-term one | Seen as a bearish, longer-term trend signal |
Why these signals lag
Moving averages, by definition, average past prices, so any crossover confirms a trend change only after it has already been underway for some time. By the time a golden cross triggers, a meaningful part of the move may already have happened.
How traders actually use them
- As a longer-term trend filter, rather than a precise entry signal
- Combined with other confirmation, such as volume or price action at key levels
- More useful on higher timeframes (daily, weekly) than for short-term trading decisions
Key takeaways
- A golden cross and death cross mark shorter-term and longer-term moving averages crossing.
- Because moving averages use past data, these signals inherently lag price.
- They work best as trend filters or context, not standalone entry triggers.
Want to trade what you read here as a CFD alongside TradingView charts? Open a Vantage account. This is an affiliate link: we may earn a commission at no extra charge from us. CFDs are complex instruments and carry a high risk of losing money rapidly due to leverage; most retail accounts lose money.
Educational content only, not investment advice. Trading and investing involve risk, including the loss of your capital. Read our Risk Disclaimer and Affiliate Disclosure.


Leave a Reply