


The income statement shows how much money a company made and spent over a period, usually a quarter or a year. This guide explains the key lines and what they reveal.
The basic flow
An income statement runs from revenue at the top to net income at the bottom, subtracting costs along the way: revenue, minus cost of goods sold, equals gross profit; minus operating expenses, equals operating income; minus taxes and interest, equals net income.
Key lines to understand
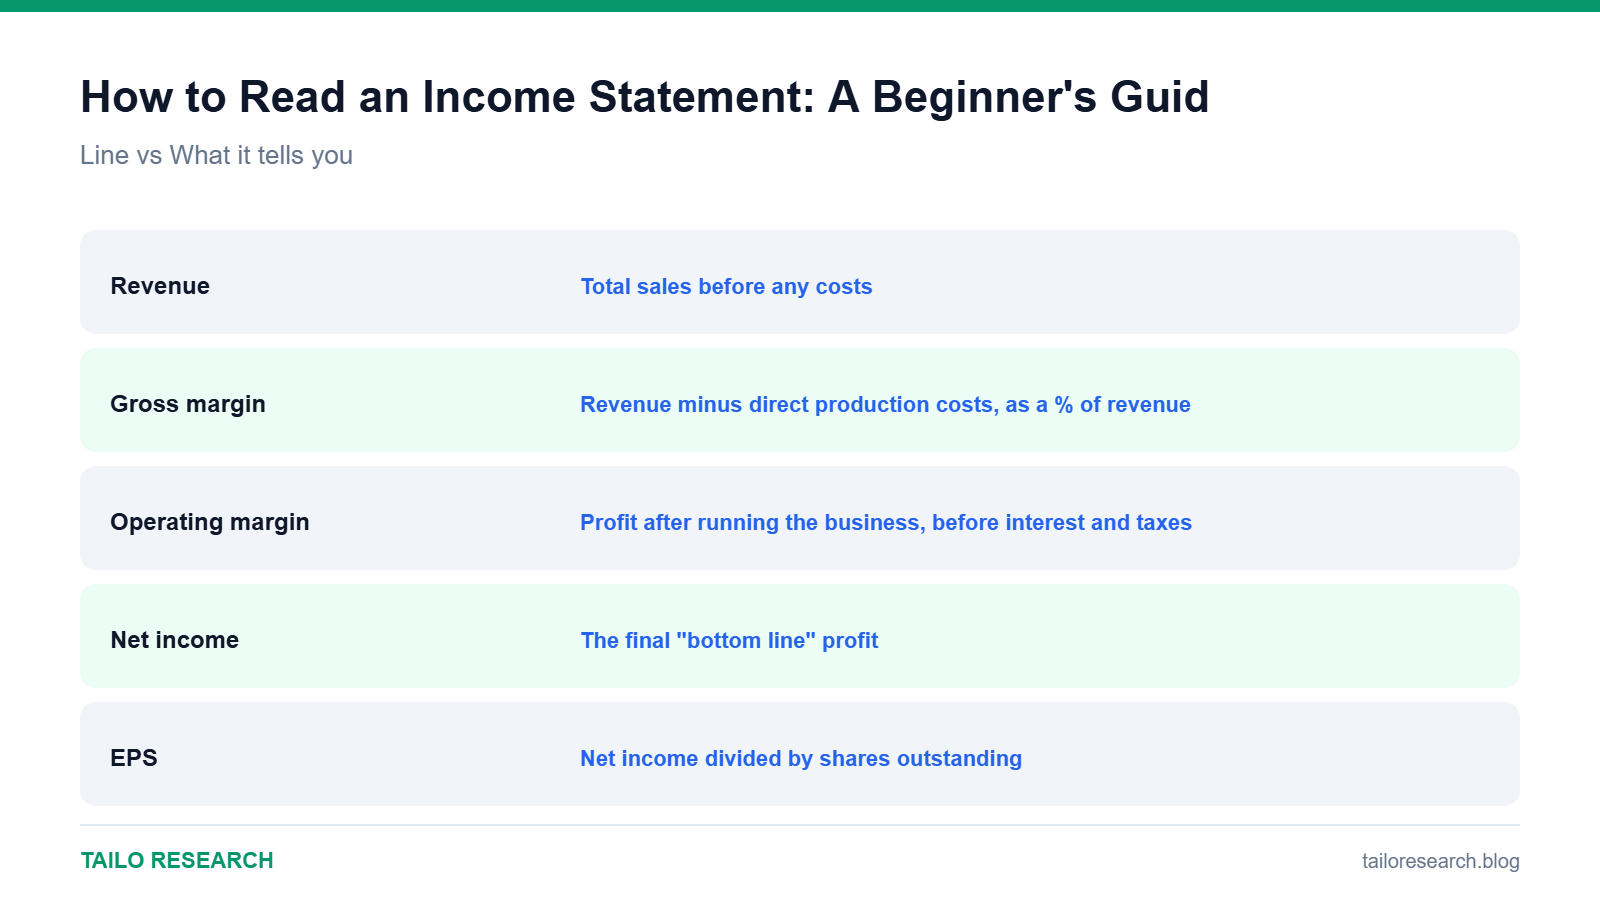
| Line | What it tells you |
|---|---|
| Revenue | Total sales before any costs |
| Gross margin | Revenue minus direct production costs, as a % of revenue |
| Operating margin | Profit after running the business, before interest and taxes |
| Net income | The final “bottom line” profit |
| EPS | Net income divided by shares outstanding |
Why margins matter more than raw numbers
A company can grow revenue while margins shrink, which often signals rising competition or costs eating into profitability. Comparing margin trends over several quarters usually reveals more than any single quarter’s headline numbers.
Key takeaways
- The income statement flows from revenue down to net income, subtracting costs along the way.
- Margin trends over time often matter more than a single quarter’s raw numbers.
- EPS, net income divided by shares outstanding, is the figure most often compared to analyst estimates.
Want to trade what you read here as a CFD alongside TradingView charts? Open a Vantage account. This is an affiliate link: we may earn a commission at no extra charge from us. CFDs are complex instruments and carry a high risk of losing money rapidly due to leverage; most retail accounts lose money.
Educational content only, not investment advice. Trading and investing involve risk, including the loss of your capital. Read our Risk Disclaimer and Affiliate Disclosure.


Leave a Reply