

A balance sheet is a snapshot of what a company owns and owes at a specific point in time. This guide breaks down the three main sections and how to read them.
The core equation
Every balance sheet follows the same equation: Assets = Liabilities + Shareholders’ Equity. Assets are what the company owns; liabilities are what it owes; equity is what would be left for shareholders if all debts were paid off.
The three sections
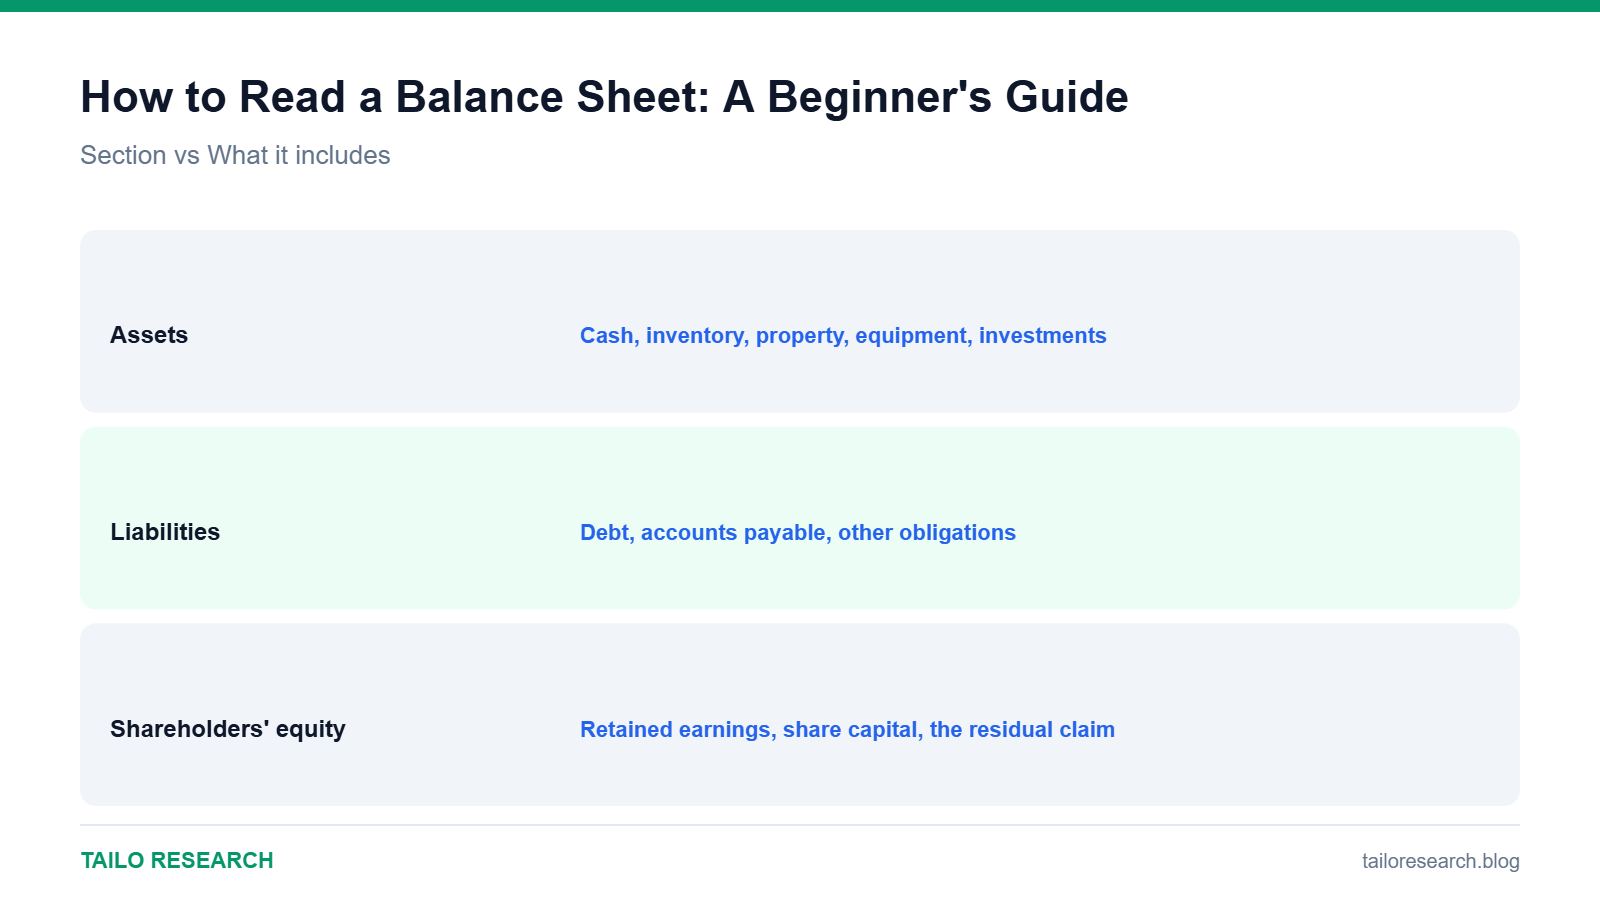
| Section | What it includes |
|---|---|
| Assets | Cash, inventory, property, equipment, investments |
| Liabilities | Debt, accounts payable, other obligations |
| Shareholders’ equity | Retained earnings, share capital, the residual claim |
Ratios worth checking
- Current ratio: current assets ÷ current liabilities, a rough measure of short-term liquidity
- Debt-to-equity ratio: total debt ÷ shareholders’ equity, showing how leveraged the company is
- Cash and equivalents: how much of a buffer the company has for downturns or opportunities
What to watch for
A balance sheet is a snapshot, not a trend, so always compare it against a few prior periods rather than a single quarter. Rising debt alongside falling cash is worth investigating further, even if current profits look fine.
Key takeaways
- A balance sheet shows what a company owns, owes and retains at one point in time.
- The current ratio and debt-to-equity ratio are quick starting points for financial health.
- Always compare against prior periods, not just a single snapshot.
Want to trade what you read here as a CFD alongside TradingView charts? Open a Vantage account. This is an affiliate link: we may earn a commission at no extra charge from us. CFDs are complex instruments and carry a high risk of losing money rapidly due to leverage; most retail accounts lose money.
Educational content only, not investment advice. Trading and investing involve risk, including the loss of your capital. Read our Risk Disclaimer and Affiliate Disclosure.


Leave a Reply