

The price-to-earnings (P/E) ratio is one of the most widely used, and most widely misunderstood, numbers in investing. This guide explains what it actually measures, how to use it properly, and where it can mislead you.
What the P/E ratio measures
The P/E ratio divides a company’s share price by its earnings per share (EPS). A P/E of 20 means investors are paying $20 for every $1 of the company’s annual earnings. In simple terms, it is a shorthand for how expensive a stock is relative to how much money the company actually makes.
Trailing vs forward P/E
| Type | Based on | Best for |
|---|---|---|
| Trailing P/E | The last 12 months of actual earnings | Comparing against a company’s own history |
| Forward P/E | Analysts’ earnings estimates for the next 12 months | Comparing growth expectations across companies |
Forward P/E is more commonly quoted in financial media because it reflects expectations, but it depends on analyst estimates being accurate, which they frequently are not.
What counts as a “high” or “low” P/E
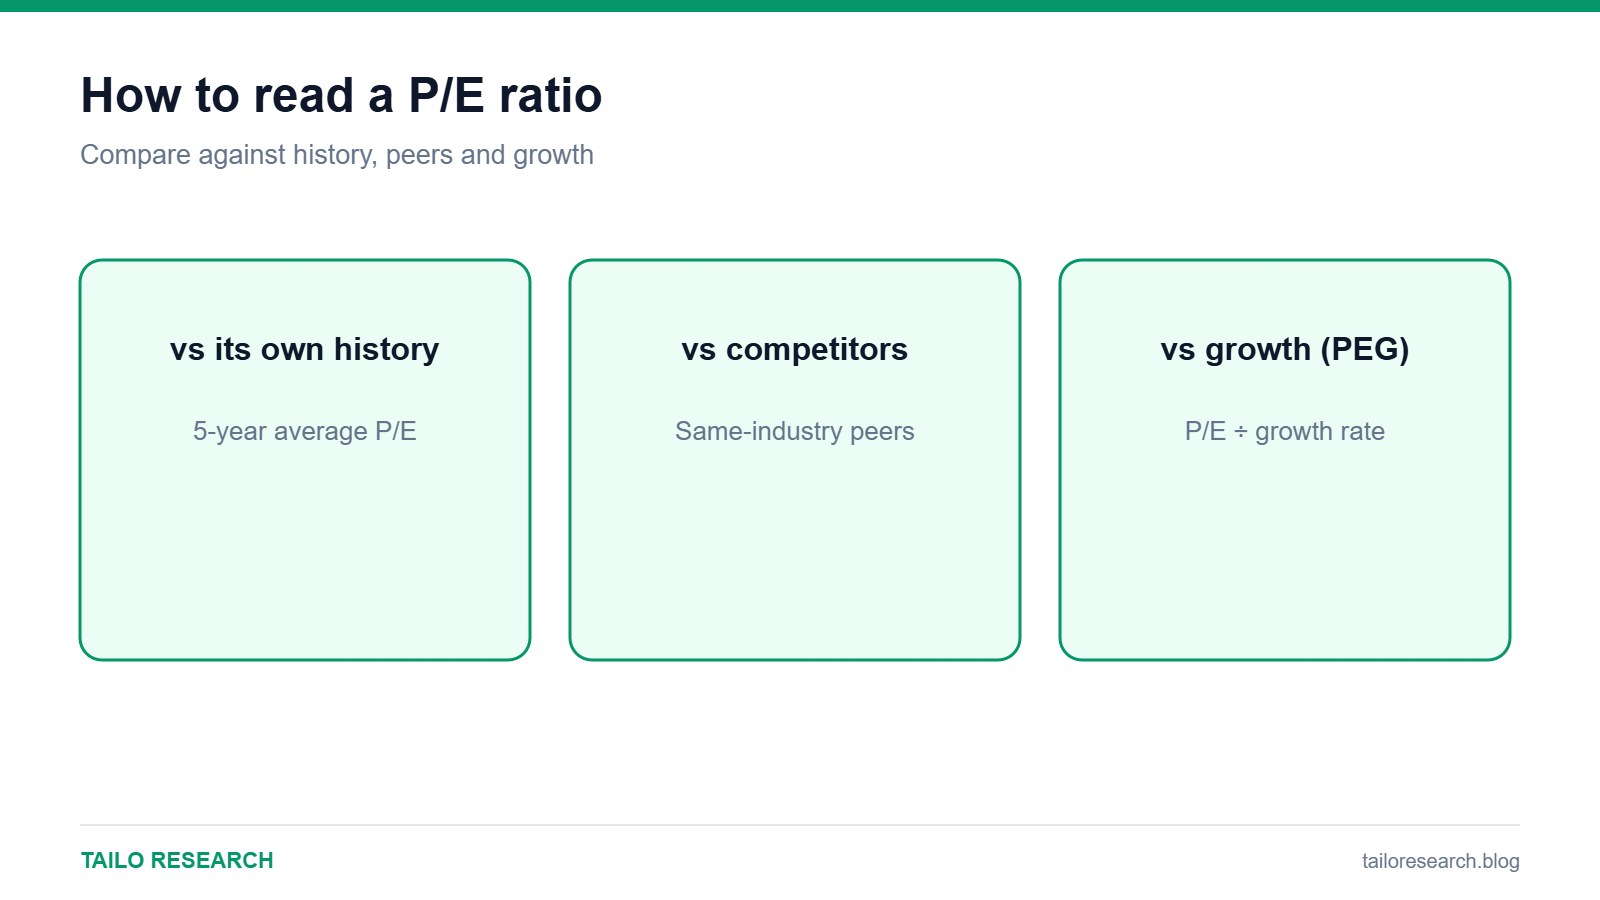
There is no universal cutoff. A P/E of 15 might be expensive for a slow-growing utility company and cheap for a fast-growing technology company. What matters is comparing a company’s P/E against three things: its own historical average, its direct competitors, and the growth rate that would justify the price.
The PEG ratio: adjusting P/E for growth
The PEG ratio divides the P/E by the company’s expected earnings growth rate, giving a rough sense of whether a high P/E is justified by high growth. A PEG near 1 is often read as fairly valued, below 1 as potentially undervalued, and above 2 as potentially expensive, though this is a rule of thumb, not a hard rule.
When P/E gives a misleading picture
- Negative or near-zero earnings: young or cyclical companies can have a meaningless or undefined P/E
- One-off items: a big asset sale or write-down can distort a single year’s earnings
- Different accounting standards: comparing P/E across companies in different countries can be misleading
- Industry differences: banks, REITs and commodity producers are usually valued on different metrics entirely (book value, funds from operations, cash flow)
A simple process for using P/E
- Check whether you are looking at trailing or forward P/E, and be consistent when comparing companies
- Compare the company’s current P/E to its own 5-year average
- Compare it to two or three direct competitors in the same industry
- Check the PEG ratio to see whether growth justifies the multiple
- Read what is driving the number: is the stock cheap because it is out of favor, or because the business is genuinely struggling?
Key takeaways
- P/E measures how much investors are paying per dollar of a company’s earnings.
- Always compare P/E against a company’s own history and its peers, not in isolation.
- PEG adjusts P/E for growth, and some industries are better valued on other metrics entirely.
Want to trade what you read here as a CFD alongside TradingView charts? Open a Vantage account. This is an affiliate link: we may earn a commission at no extra charge from us. CFDs are complex instruments and carry a high risk of losing money rapidly due to leverage; most retail accounts lose money.
Educational content only, not investment advice. Trading and investing involve risk, including the loss of your capital. Read our Risk Disclaimer and Affiliate Disclosure.


Leave a Reply