

Hello, this is Tailo Research. Here’s today’s Nasdaq 100 (NAS100) technical breakdown — first revisiting the previous setup, then working through the daily, 1-hour, and 15-minute charts to map out where price is likely headed next.
Revisiting the Previous Setup
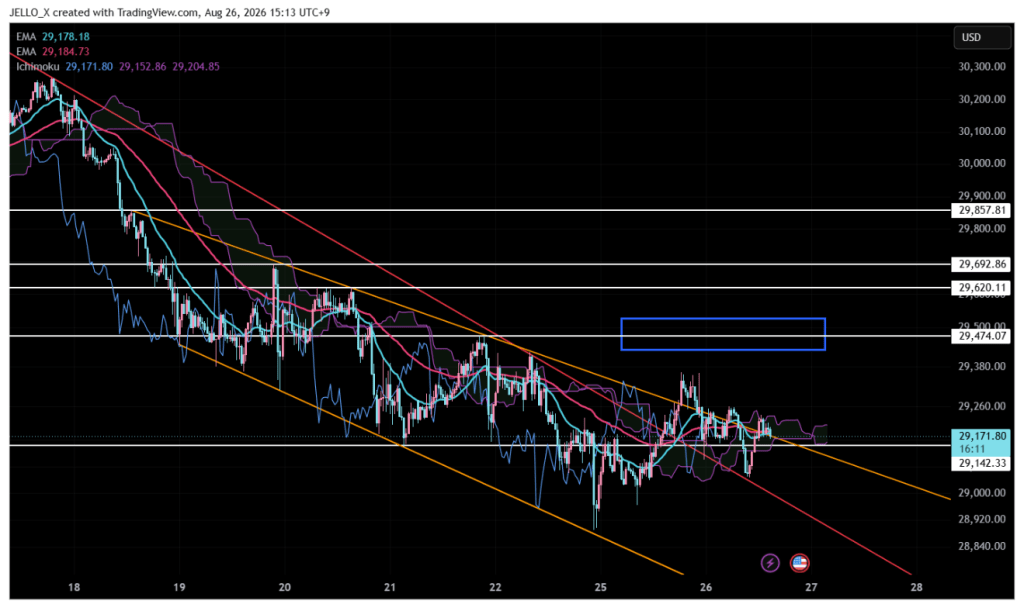
Looking back at the chart, price did break out of the descending broadening pattern once the resistance trendline gave way. However, as flagged in the previous update, price never followed through above the 29,474 level, and that failure has since pulled the market back into a corrective phase.
Given that, downside risk is still very much in play, and it’s too early to say the correction is over.
Daily Chart
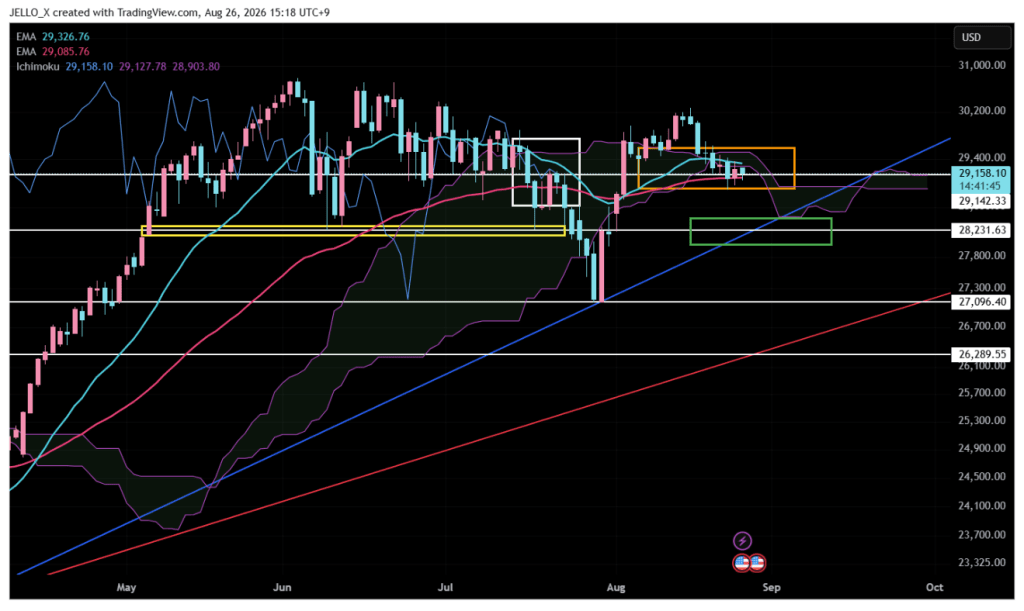
On the daily chart, candles are currently forming below the Ichimoku cloud, and price continues to face resistance from the cloud above. Inside the white box, the Chikou Span (lagging line) sits just above the candles, finding support there — it has already pushed through the cloud and is now consolidating within it.
Price itself is chopping sideways between the 20-day and 60-day moving averages. Since Monday’s large bearish candle, the market hasn’t broken below the recent low at 28,891, nor has it managed to clear the recent high — so this has essentially been a sideways week since that candle printed.
The long-term blue uptrend line, together with the 28,230 level, remains the most important inflection point for Nasdaq right now — whether that zone holds or breaks will be critical for determining the market’s next direction.
1-Hour Chart
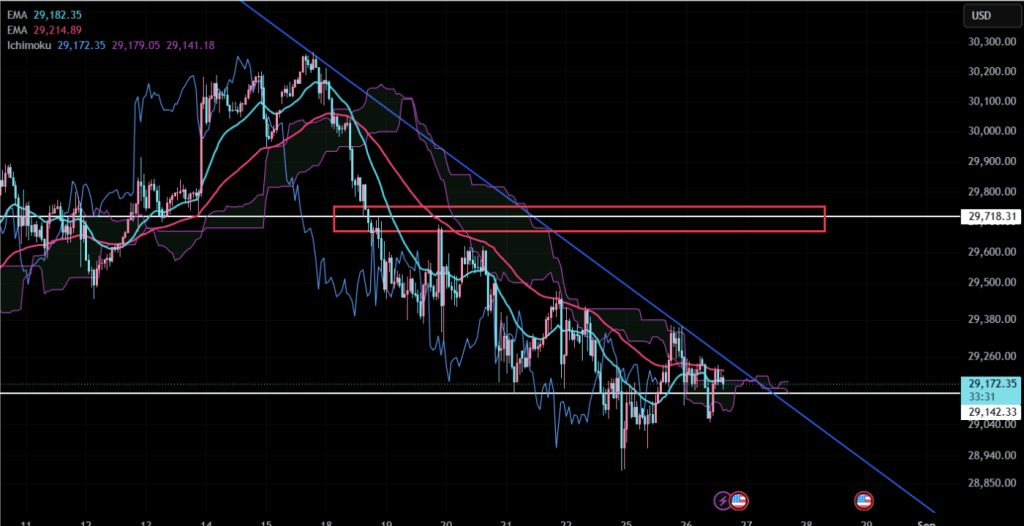
On the 1-hour chart, Nasdaq has been printing lower highs as it continues to make fresh lows on this decline. Taking a step back, the broader structure won’t shift until price reclaims 29,718 to the upside — even if a bounce does show up before then, it would just be movement within the existing supply zone rather than a genuine trend reversal.
15-Minute Chart
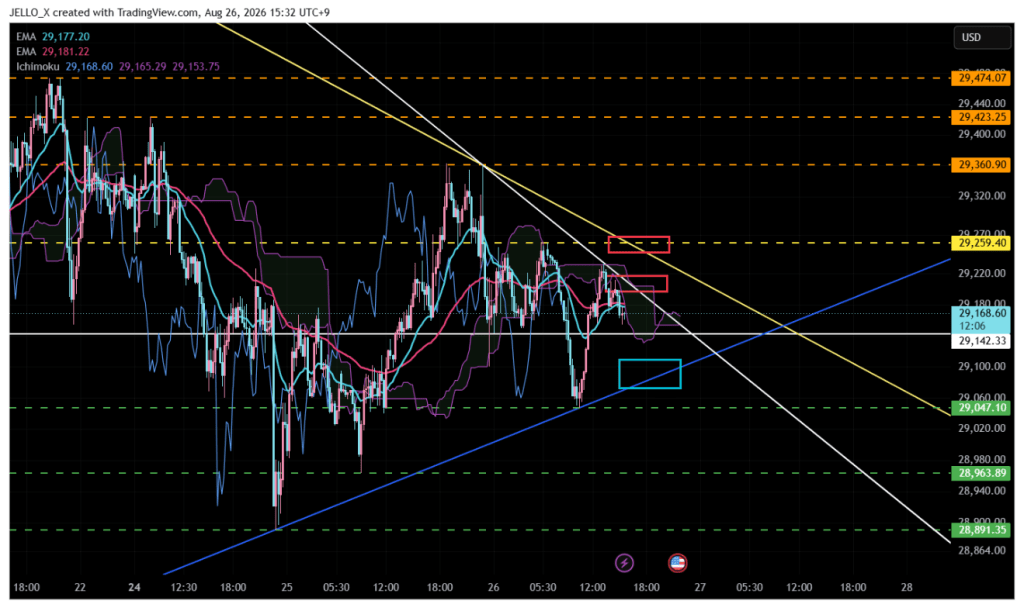
On the 15-minute chart, Nasdaq looks to be testing support after a modest bounce. The 29,142 level has proven to be fairly strong support — it’s held on roughly three separate occasions in the past — and it continues to do its job as a reliable support zone.
Buy Strategy
Two potential long setups are in play here, both invalidated by the same condition:
- Entry 1: On a breakout above the short-term white resistance trendline
Take Profit: Near the next yellow resistance trendline
Stop Loss: If the blue uptrend line is broken - Entry 2: On a breakout above the short-term yellow resistance trendline and the 29,260 level
Take Profit: At the orange horizontal level
Stop Loss: If the blue uptrend line is broken
Sell Strategy
- Entry: If the blue uptrend line is broken to the downside
Take Profit: At the green horizontal level
Stop Loss: If the short-term white resistance trendline is broken to the upside
If you want to trade Nasdaq 100 (NAS100) using the levels and setups covered in this analysis, Vantage Markets gives you direct access to NAS100 CFDs with competitive spreads and fast execution. Open a free Vantage Markets account and start trading NAS100.
This content is for informational and educational purposes only and does not constitute financial advice. Trading CFDs carries a high level of risk and may not be suitable for all investors. Past performance is not indicative of future results. Please read our full Risk Disclaimer and Affiliate Disclosure.
 Tailo-Research
Leave a comment